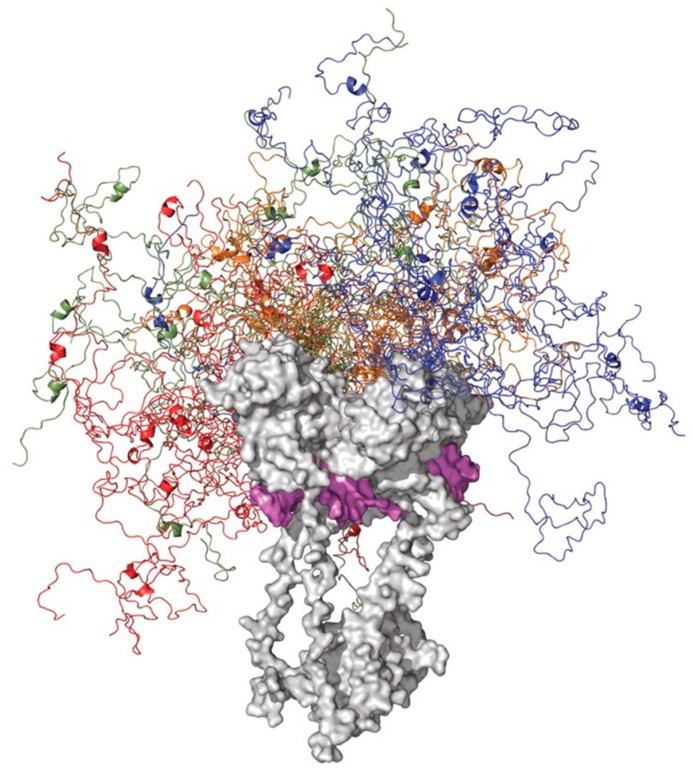
Figure 5.
Modeled structure of the DNA-bound 1–360 region of p53. Here, the average ensemble structure of the N-terminal region (residues 1–95) is grafted to the DNA-bound p5396–360 region, where the p5396–360 (gray) and DNA (magenta) are shown in space-fill mode, and the N-terminal domains forming the four different monomers are shown in different colors for clarity. Twenty members of the conformational ensemble are shown for each monomer. This image is reproduced from the reference [121].

