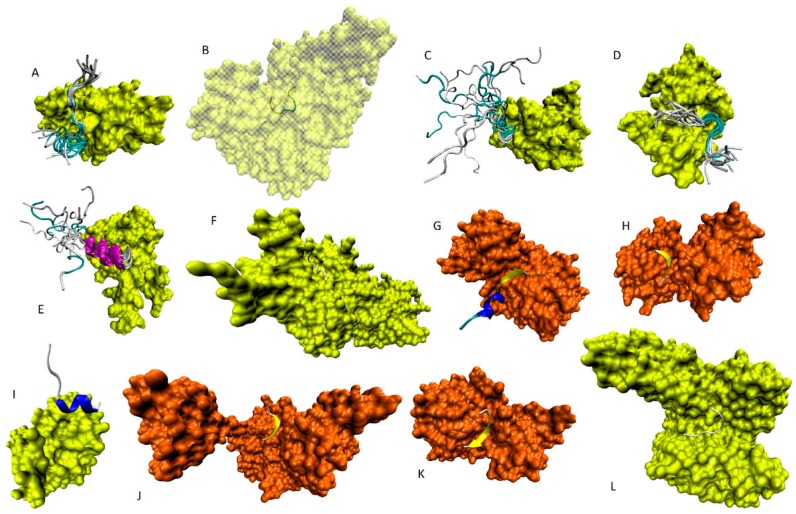
Figure 8.
Complexes of the p53 fragments derived from its C-terminal region and bound to different partners. Here, the first row of structures represents complexes involved: (A) 363–377 (PDB ID: 2MWO); (B) 365–377 (PDB ID: 3TG5); (C) 367–386 (PDB ID: 1JSP); and (D) 367–387 (PDB ID: 2MWP), fragments; The second row has complexes of the following p53 fragments: (E) 367–388 (PDB ID: 1DT7); (F) 369–377 (PDB ID: 1XQH); (G) 372–389 (PDB ID: 1YC5); and (H) 376–388 (PDB ID: 4BV2); The third row represents complexes involving the (I) 377–386 (PDB ID: 4X34); (J) 379–383 (PDB ID: 4ZZJ); (K) 379–386 (PDB ID: 4BUZ); and (L) 385–393 (PDB ID: 3LW1) fragments of p53. Structures of protein-binding partners are shown as yellow or orange surfaces, whereas structures of p53 fragments are shown as ribbons colored according to the secondary structure content. In panel B, structure of binding partner (N-lysine methyltransferase SMYD2) is shown in a semi-transparent form to simplify visualization of the position of the p53 polypeptide chain within the corresponding complex.

