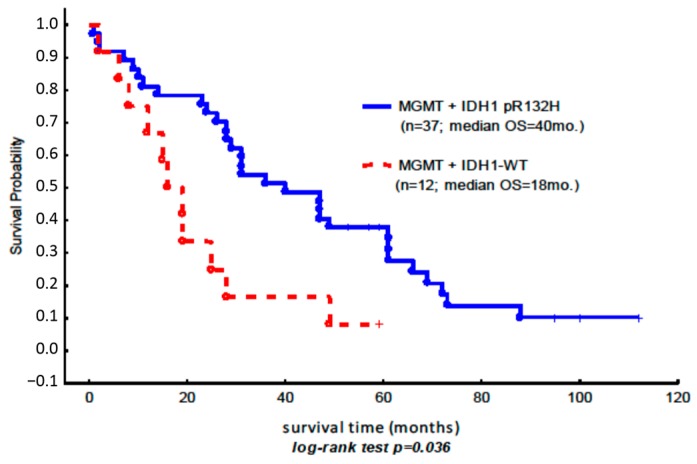
Figure 1.
Kaplan–Meier overall survival curves for the subgroup of patients with MGMT promoter methylation, in which the assessment of the methylation status based on the comparison between the methylated (M) and unmethylated (U) amplicons was equal to or higher than 1 (Table 3). The blue line shows the Kaplan–Meier overall survival curves for the subgroup of patients with the somatic mutation IDH1 p.R132H and the concurrent hypermethylation of MGMT (n = 37 (7 + 30)); the red line indicates the methylation of MGMT (n = 12 (7 + 5)) and the wild-type IDH1 gene (Table 3).

