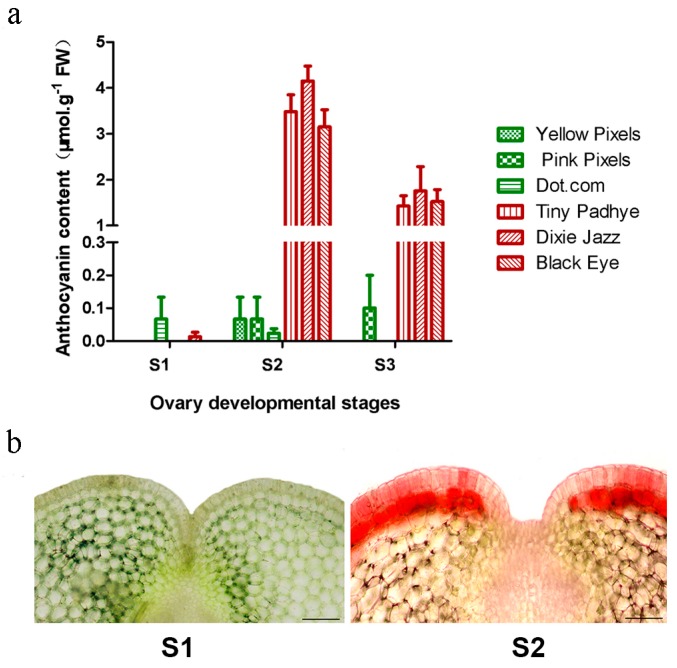
Figure 2.
Relative anthocyanin content and cross sections of ovaries. (a) The relative anthocyanin content of lily ovaries at different developmental stages. Error bars show the standard error (SE) of the mean; (b) Cross sections of ovaries of Asiatic “Tiny Padhye” at developmental stage 1 and stage 2. Scale bars: 100 μm.

