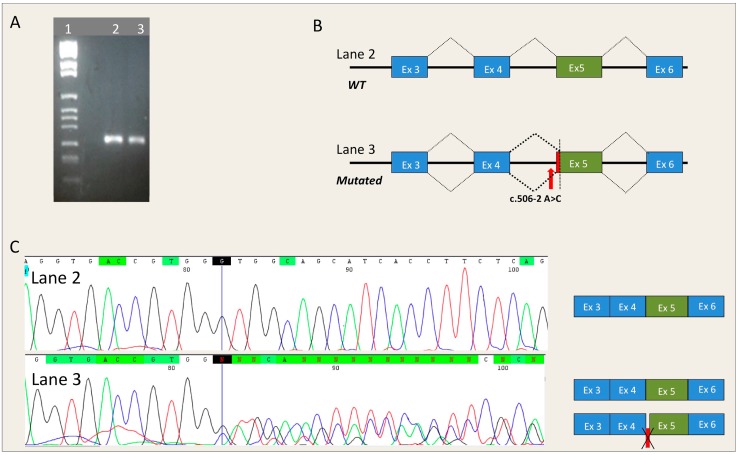
Figure 1.
Effect of the MYBPC3-c.506-2A>C mutation on the splicing mechanism. (A) Electrophoresis of the RT-PCR analysis of mRNA extracted from the peripheral blood of a patient carrying the MYBPC3-c.506-2A>C mutation. Lane 1: Marker IX (Roche Diagnostics); Lane 2: Control; Lane 3: Patient carrying the MYBPC3-c.506-2A>C mutation; (B) Schematic representation of the splicing process in subjects with and without the MYBPC3-c.506-2A>C mutation. The red arrow represents the position of the mutation, the red box represents the deletion of seven nucleotides occurring in exon 5 of MYBPC3; (C) Electropherograms obtained from DNA sequencing of the fragments shown in panel A and relative splicing results (Black, red, green and blue peaks represent the G, T, A, and C bases, respectively). Deletion of seven nucleotides is represented by a red box. The blue line in the electropherograms indicates the end of exon 4 of MYBPC3 cDNA.

