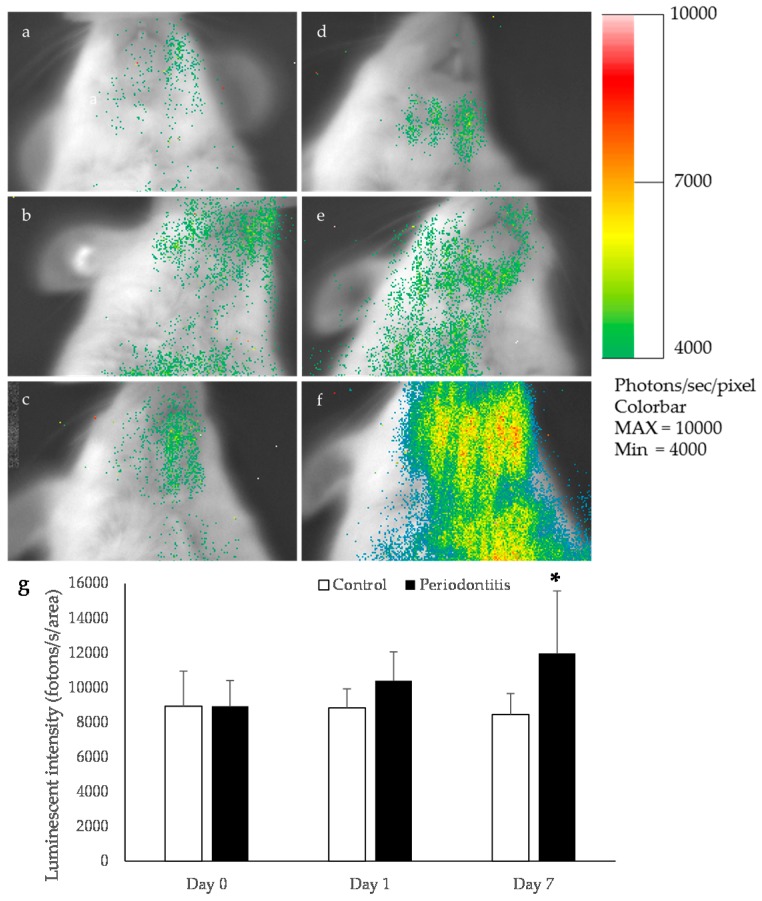
Figure 3.
Bioluminescence imaging in oxidative stress detector-luciferase (OKD-LUC) mice. The color scale bar shows the photon counts. Representative photographs taken at baseline (a); the control group at day 1 (b) and day 7 (c); the periodontitis group just after ligation (d); and the periodontitis group at day 1 (e) and day 7 (f). In the periodontitis group, a high luminescence intensity was observed in the mandibular area at day 7 (d). This luminescence intensity was significantly higher in the periodontitis group than in the control group (* p < 0.05, t-test) (n = 6/group) (g).

