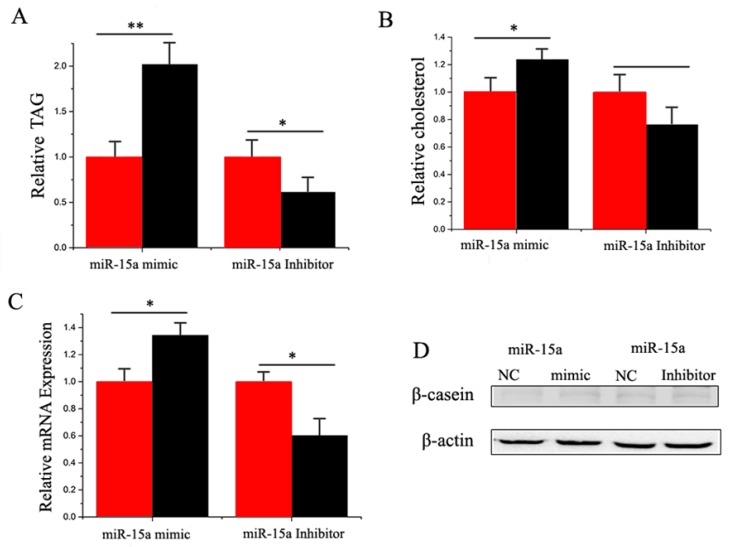
Figure 6.
(A) Triglyceride levels in cells transfect with miR-15a mimic or inhibitor; triglyceride levels in transfected cells were compared with that of miR-15a controls (n = 6). Red bars represent the negative control; black bars represent miR-15a mimic or inhibitor; (B) Cholesterol levels in transfected cells were compared with that of control (n = 6). Red bars represent the negative control; black bars represent miR-15a mimic or inhibitor; (C) The expression of β-casein was quantified by RT-qPCR (n = 6); (D) The effect of miR-15a mimic or inhibitor on β-casein protein expression was evaluated by Western blot in GMEC. Total protein was harvested 48 h post-treatment, respectively. All experiments were duplicated and repeated three times. Values are presented as means ± standard errors, * p < 0.05; ** p < 0.01.

