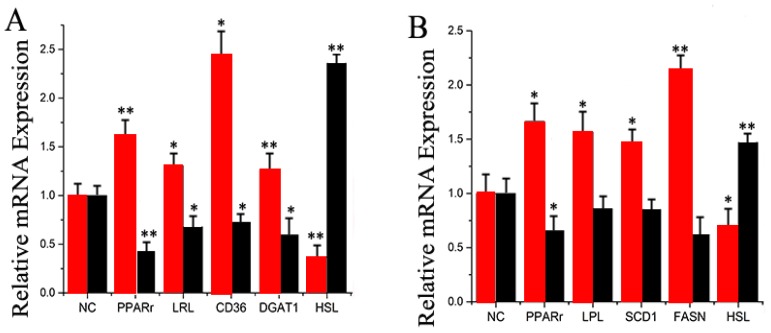
Figure 7.
(A) Expression of fatty acid metabolism-related genes. The mRNA expression of PPARγ, LPL, CD36, DGAT1, and HSL was quantified by RT-qPCR (n = 6). Red bars represent the miR-30e-5p mimic; black bars represent the miR-30e-5p inhibitor; (B) Expression of fatty acid metabolism-related genes. The mRNA expression of PPARγ, LPL, SCD1, FASN, and HSL was quantified by RT-qPCR (n = 6). Red bars represent the miR-15a mimic; black bars represent the miR-15a inhibitor. All experiments were duplicated and repeated three times. Values are presented as means ± standard errors, * p < 0.05; ** p < 0.01.

