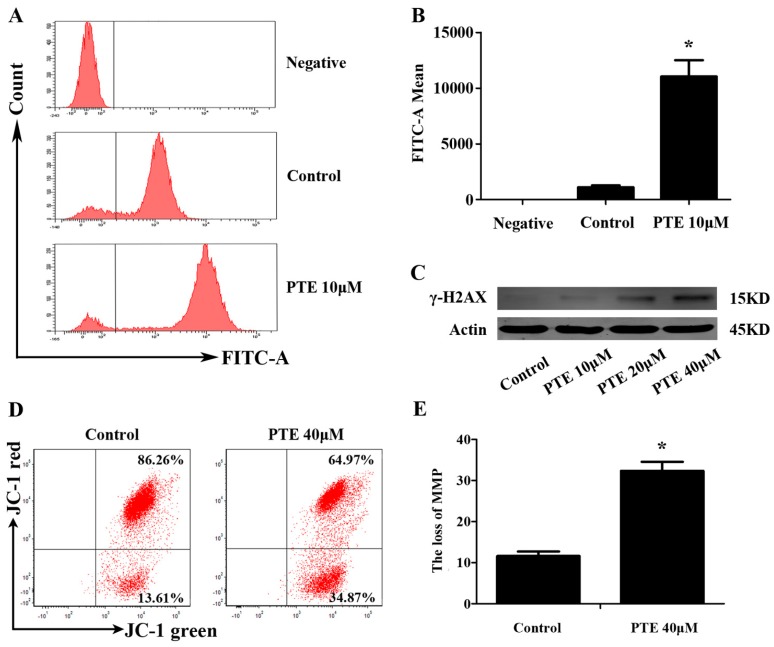
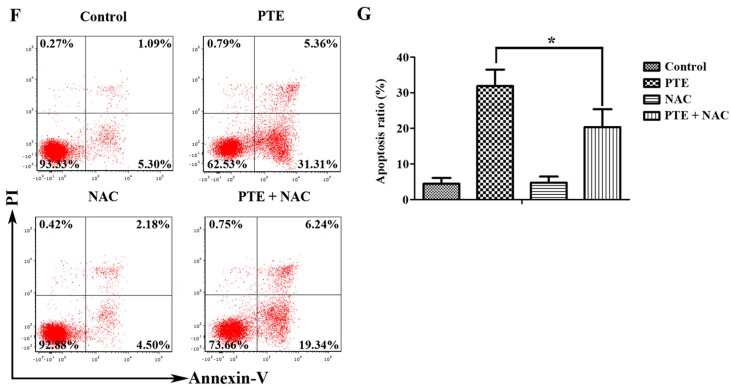
Figure 4.
PTE enhances the level of reactive oxygen species (ROS) generation and loss of mitochondrial membrane potential (MMP). (A) H929 cells were treated with PTE (10 μM) for 24 h, and the level of ROS was detected by flow cytometry; (B) the fluorescence intensity of negative, control and PTE treatment groups. Data is presented as mean ± SD (n = 3, * p < 0.05); (C) the protein levels of γ-H2AX as assessed by Western blot; (D) MM cells were treated with PTE (40 μM) for 24 h and MMP was analyzed by flow cytometry; (E) JC-1 mitochondrial membrane potential assay green positive cells in control and PTE treatment groups. Data is presented as mean ± SD (* p < 0.05, n = 3); (F) H929 cells were pre-incubated with or without N-acetyl-l-cysteine (NAC) (10 mM) for 2 h and then treated with PTE (20 μM) for 48 h, stained with AnnexinV-FITC/PI and analyzed by flow cytometry; and (G) the percentage of FITC positive cells treated with 20 μM of PTE that pre-incubated with or without NAC. Data is presented as mean ± SD (n = 3, * p < 0.05).


