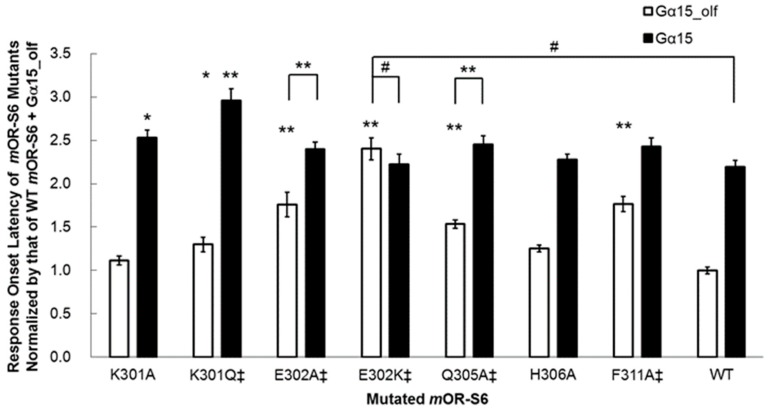
Figure 4.
Response onset latency is markedly increased for Gα15_olf but not for Gα15 in in mOR-S6 E302K (from Reference [7] with permission for authors). The average Ca2+ responses to cc9 are shown for mOR-S6 helix 8 mutants. Selective inactivation via Gα15_olf or Gα15 is indicated by ‡. Statistical significance was determined by the t-test and is labeled at the top of each bar (# p ≥ 0.01; 0.001 ≤ * p < 0.01; ** p < 0.001).

