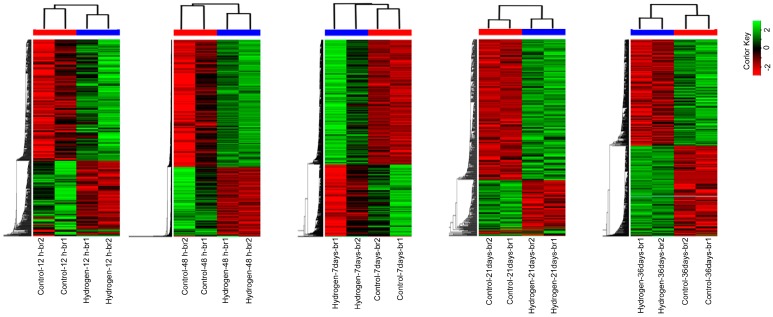
Figure 2.
Hierarchical clustering maps of differentially expressed genes (DEGs) after 12 h, 48 h, 7 days, 21 days, and 36 days of hydrogen treatment. The color scale shows log2 fold changes (FC). FC = normalized TPM (transcripts per million) values in H2-treated PEMs/normalized TPM (transcripts per million) values in control PEMs. br1/br2: two biological replicates, respectively. Red color line indicates br1/br2 clustering of control PEMs and blue color line indicates br1/br2 clustering of H2-treated PEMs at each time point.

