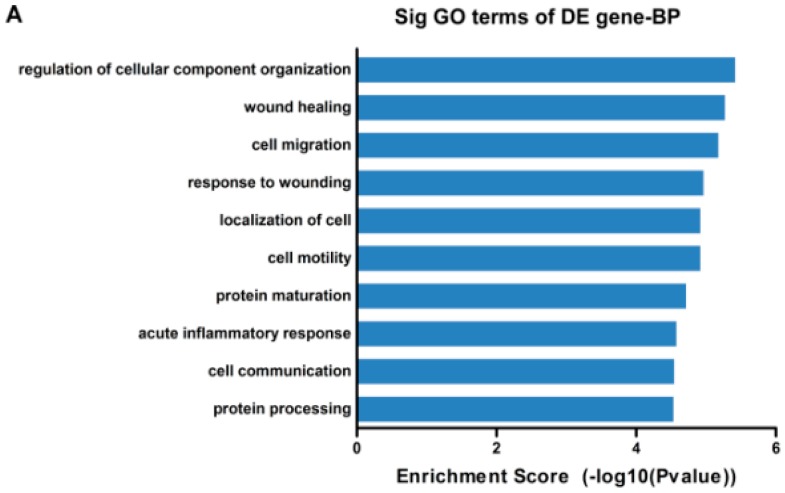
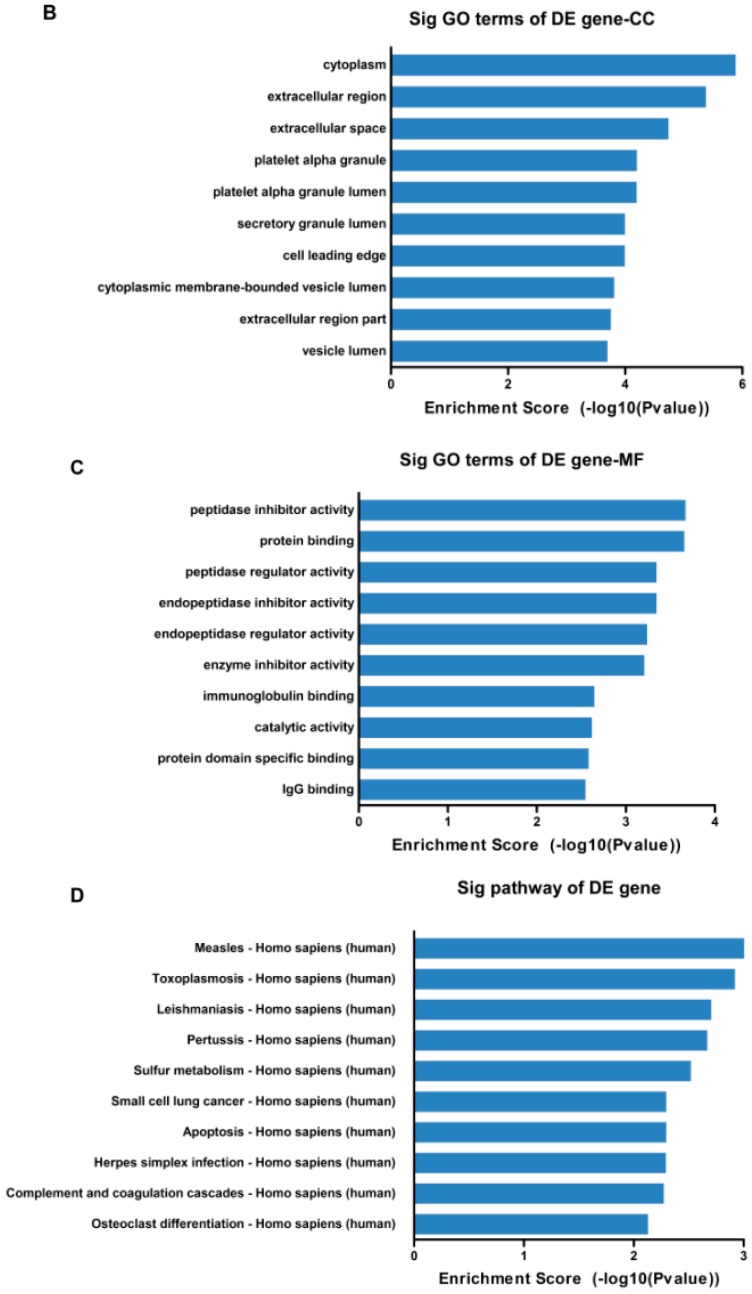
Figure 2.
Gene ontology (GO) and pathway analysis of dysregulated genes in high metastatic potential NPC cell lines when compared with low metastatic potential NPC cell lines. (A–C) the top ten enrichment score (−log10 (p-value)) values for significantly enriched GO terms including Biological Process (A), Cellular Component (B) and Molecular Function (C), and (D) the top ten highest and significant pathways. p-Values were calculated using the significance test (A–C) and Fisher’s exact test (D).


