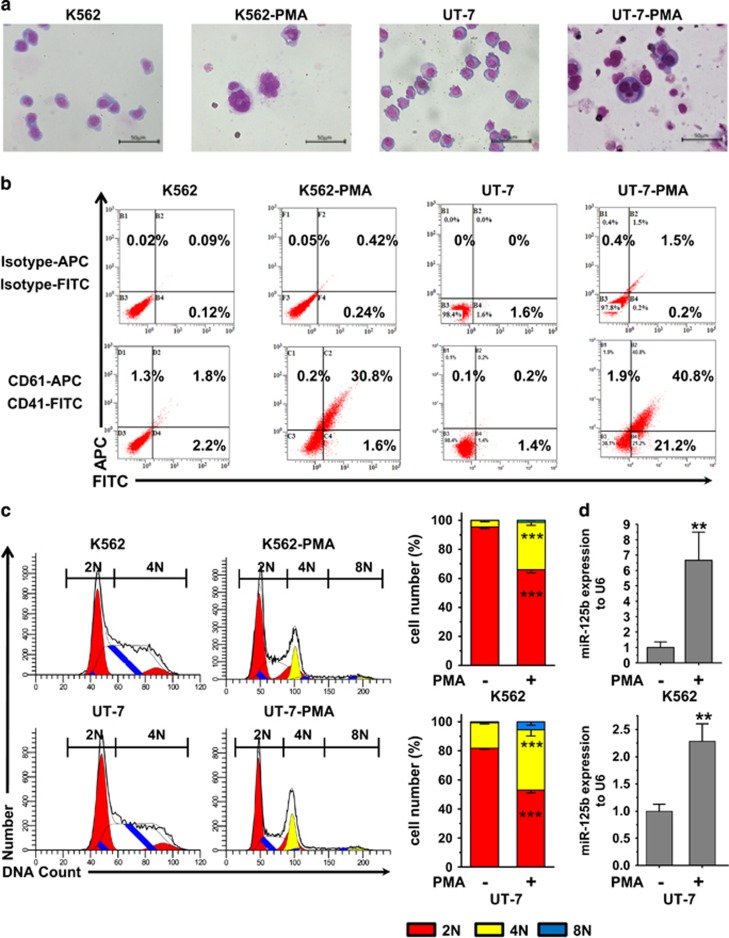
Figure 2.
MiR-125b is enriched in PMA-induced K562 and UT-7 megakaryocytic cells. PMA treatment induces megakaryocytic differentiation of K562 and UT-7 cells. (a) Morphology of K562 and UT-7 cells before and after PMA treatment. Cells were stained with Wright–Giemsa solutions. (b) Flow cytometry analysis of CD41 and CD61. (c) DNA ploidy analysis by flow cytometry of K562 and UT-7 cells. In the ploidy mode, first cell cycle represents diploidy, which is shown by red color. Second cycle is polyploid, which color is yellow. White peaks and peaks filled with blue lines represent the S phase. Cells in the G1 and S phase of diploidy are 2N as judged by chromosome count. 4N is the sum of the G2 and M phase from diploidy and the G1 and S phase from polyploidy. 8N is the G2 and M phase of polyploidy. 2N-PMA versus 2N+PMA and 4N-PMA versus 4N+PMA show significant difference. DNA ploidy up to 8N only can be observed in PMA-treated cells (2N, red; 4N, yellow; 8N, blue). (d) qPCR analysis of miR-125b levels in undifferentiated or PMA-treated K562 and UT-7 cells. The endogenous expression of miR-125b in megakaryocytic cells increases after PMA treatment. U6 was used as an endogenous miRNA expression control. All of the data are expressed as the mean±S.D. from at least three independent experiments. Student t-tests were used for statistical analysis. ***P<0.001 and ** P<0.01

