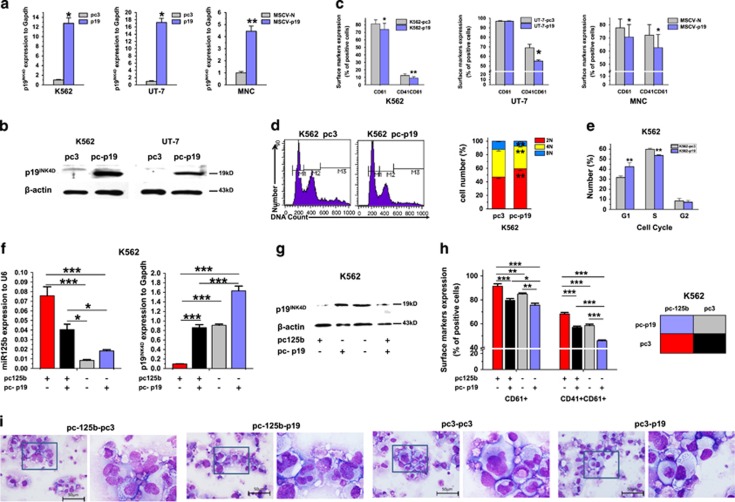
Figure 8.
Enforced p19INK4D expression reduces MK differentiation. (a) P19INK4D expression was measured in K562 and UT-7 cells stably transfected with pcDNA3.1 (control) or pcDNA3.1-p19INK4D and MNCs infected with HA-tagged p19IK4D-expressing retrovirus by qPCR. Error bars represent the standard deviation of the mean of three repeated experiments. (b) Western blot analysis of p19INK4D expression in K562 and UT-7 cells overexpressing p19INK4D. (c) Overexpression of p19INK4D reduced expression of MK markers in K562 cells, UT-7 cells and mononuclears, as assessed by flow cytometry. (d) DNA ploidy analysis by flow cytometry of K562 cells stably transfected with pcDNA3.1 (control) or pcDNA3.1-p19INK4D. A representative experiment is shown on the right panel, as well as the mean (±S.D.) percentage of cells in each ploidy (2N, red; 4N, yellow; 8N, blue). (e) Percentage of cells in each cell-cycle phase from p19INK4D-overexpressing K562 cells. (f) P19INK4D and miR-125b expression were measured in K562 cells stably co-transfected with pcDNA3.1-puromycin/pcDNA3.1-p19INK4D-puromycin and pcDNA3.1-neomycin/pcDNA3.1-pri-miR-125b-neomycin by qPCR. (g) Western blot analysis of p19INK4D- and miR-125b-comodified K562 cells. (h) Flow cytometry analyses of MK marker expression. (i) MK morphology change after p19INK4D and miR-125b comodification. All of the data are expressed as mean±S.D. from at least three independent experiments. Individual comparisons between two groups were performed using Student's paired t-test. Bonferroni's multiple comparison test for multiple comparisons was applied. *P<0.05 and **P<0.01 (scale bars: 50 μm)

