Figure 2.
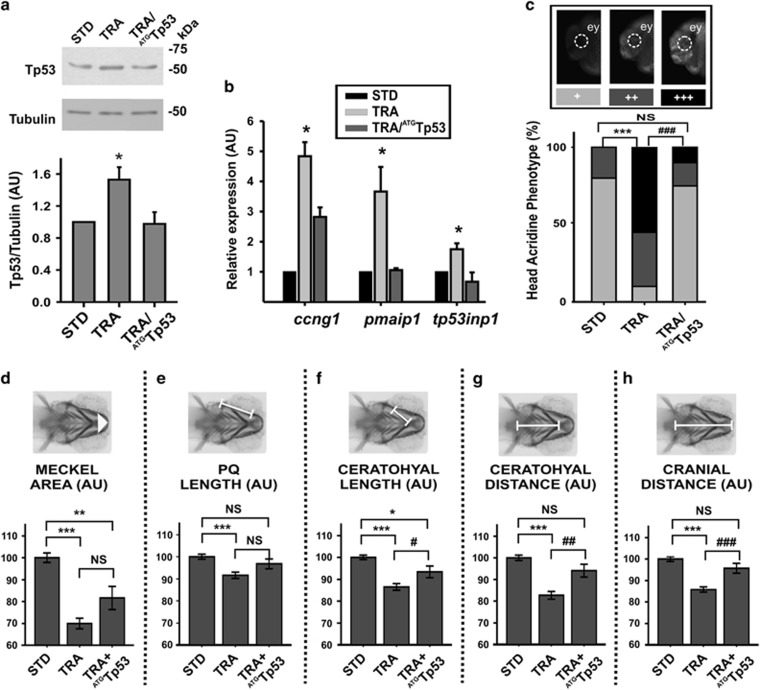
Craniofacial phenotypes generated by tcof1 knockdown were partially rescued by Tp53 depletion. (a) Western blotting showing the Tp53 abundance in control (STD), TRA and TRA+ATGTp53 24 hpf embryos. Molecular weight markers are shown at the right. Tubulin was analyzed as a loading control. The graph shows the densitometric quantification of western blotting band (normalization of Tp53 signal with respect to tubulin). Bars represent mean of relative abundance and S.E.M., n=3, *P<0.05 (t-test) AU: arbitrary units. (b) Expression analysis of Tp53 targets: ccng1 (encoding cyclin G1), pmaip1 (encoding Noxa) and tp53inp1 (encoding tumor protein p53-inducible nuclear protein 1) in control (STD), TRA and TRA+ATGTp53 24 hpf embryos. Bars represent mean of relative abundance and S.E.M., n=3, *P<0.05, (ANOVA test). (c) Acridine Orange staining in vivo performed in 24 hpf embryos. Representative photos of embryos displaying normal (+), intermediate (++) or extensive (+++) cell death. The bar graph shows the distribution of each phenotype among the groups (STD, TRA and TRA+ATGTp53 embryos). ey=eye, n=50 embryos in each of three independent experiments. ***P<0.001 versus STD; ###P<0.001 versus TRA; NS=non-significant P>0.05 (chi-square test). (d–h) Quantification of craniofacial parameters (as defined in Figure 1) measured in STD, TRA-MO TRA+ATGTp53 larvae (4 dpf), stained with Alcian Blue. (d) Meckel Area, (e) PQ, (f) Ceratohyal length, (g) CD, (h) Cr. Bars represent means in AU and S.E.M. n=47 for STD, n=79 for TRA, n=30 for TRA+ATGTp53. *P<0.05, **P<0.01, ***P<0.001 versus STD; #P<0.05, ##P<0,01 ###P<0.001 versus TRA; NS=non-significant P>0.05 (t-test)

