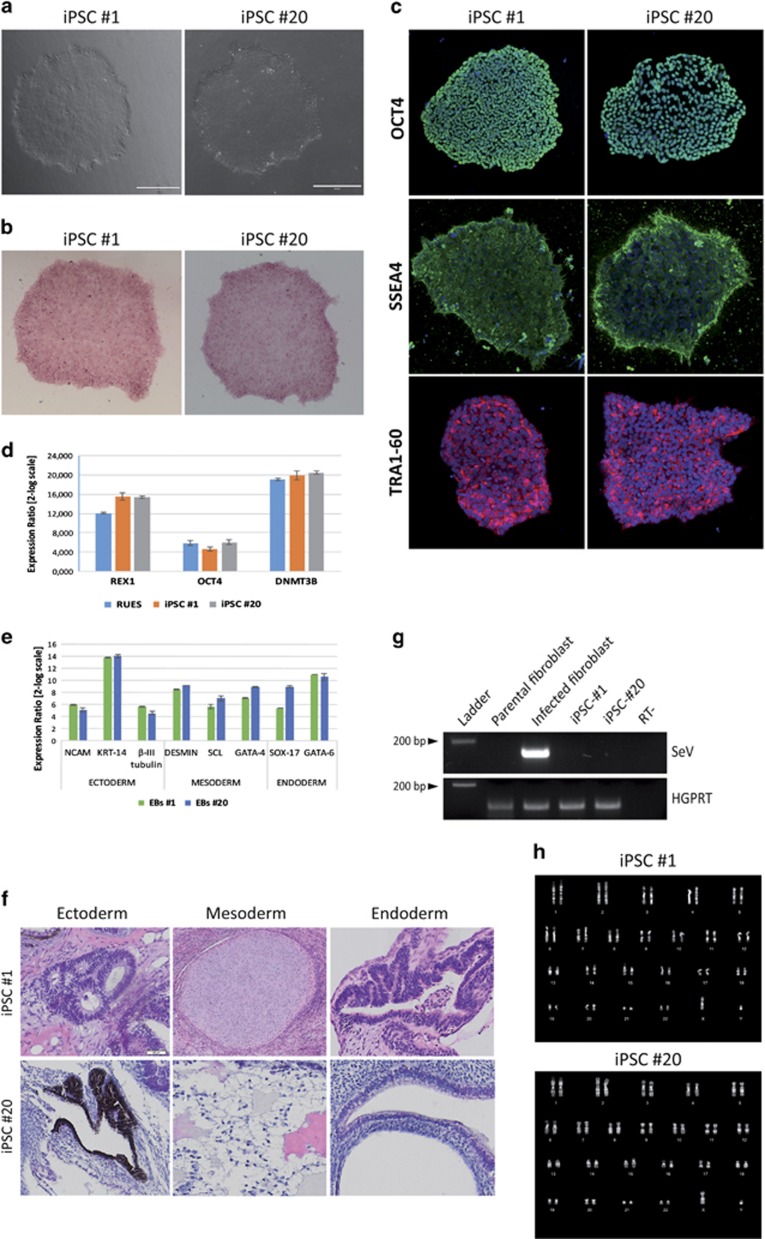
Figure 2.
Generation of iPSCs from skin biopsy of a CPVT2 patient. (a) Phase-contrast images of iPSC colonies, from both clones (#1 and #20) reprogrammed from the proband B05 (HO) and subsequently used for the experiments. Scale bar: 400 μm (b) Representative images of iPSC colonies (one each iPSC line) showing positive staining for alkaline phosphatase activity. (c) Immunostaining of CPVT-iPSC lines (clones #1 and #20) showing expression of stemness-specific markers OCT-4 (top), SSEA-4 (middle) and TRA1-60 (bottom). (d) Semiquantitative real-time PCR showing upregulation of specific markers of pluripotency (Rex-1, DNMT3B and Oct4) in two CPVT-iPSC clones (#1 and #20). The data are presented relative to parental fibroblasts and were normalized to HGPRT expression; RUES2 embryonic stem cell line has been used as positive control reference. Values are mean ±S.E. Diagram shows results from one representative experiment (out of three). (e–f) Evaluation of the developmental competence of CPVT-iPSC lines by embryoid bodies aggregation (e) and teratoma formation assay (f). Panel E show the results of semiquantitative real-time PCR of EBs from two CPVT-iPSC lines (#1 and #20) at d30 of differentiation and indicate upregulation of expression of markers of the three germ layers in EBs obtained from both lines. The data are relative to undifferentiated iPSC and were normalized to HGPRT and 18S housekeeping genes expression. Values are mean ±S.E. Diagram shows results of one representative experiment (out of three). (f) Hematoxylin-eosin staining of teratomas formed by CPVT-iPSC lines injection into immunocompromised mice, showing presence of tissues that derive for all the three germ layers: neural rosettes and retinal epithelium are indicative of ectoderm formation, cartilage and adipose tissue are from mesoderm, and gut and respiratory epithelium indicate presence of endodermal differentiation. (g) RT-PCR against the SeV genome indicating loss-of-expression of the SeV exogenous genes in both the iPSC clones (#1 and #20) selected for the study. Parental fibroblasts and those infected with SeV genes for reprogramming have been respectively used as negative and positive controls. Detection of HGPRT gene expression has been used as loading control. (h) Representative image of the analysis of the karyotype of the iPSC lines generated from the proband, showing the reprogramming did not induce any major chromosomal abnormality

