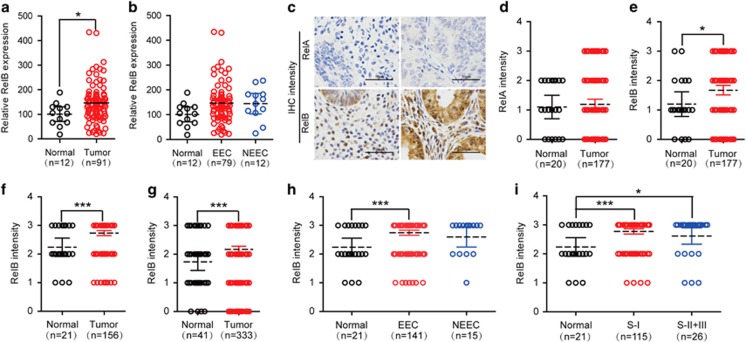
Figure 1.
A significant increase in the alternative RelB/NF-κB is noted in EEC. (a) GEO gene array data for RelB expression in EC (n=91) patients versus normal controls (n=12). (b) GEO gene array analysis for RelB expression in EEC (n=79) and NEEC (n=12) compared with controls (n=12). (c-e) Photographs (c) and quantification of RelA (d) and RelB (e) IHC staining of EC (n=177) and controls (n=20) from TMA-1, demonstrating significant upregulation of RelB protein in EC specimens. The IHC score was evaluated blindly by combining the percentage of staining intensity with positive staining as follows: 0 (negative, no positive cells), 1 (weak, 0–10%), 2 (moderate, 10–60%) and 3 (strong, >60%), the same below. (f) Quantification of RelB IHC staining in EC (n=156) versus normal controls (n=21) from TMA-2. (g) Combined analysis of RelB IHC staining in EC (n=333) compared with controls (n=41) from TMA-1 and TMA-2. (h) Stratified quantification of RelB expression in EEC (n=141) and NEEC (n=16) compared with normal controls (n=21) in TMA-2, displaying elevated RelB in EEC but not NEEC. (i) Hierarchical quantification of RelB IHC staining in relation to the FIGO stage of EEC from TMA-2, revealing that increased RelB is not clearly correlated with the FIGO stage of EEC. All analyzed data are presented as a scatter dot blot, with a line showing the mean and 95% CI, *P<0.05, ***P<0.001

