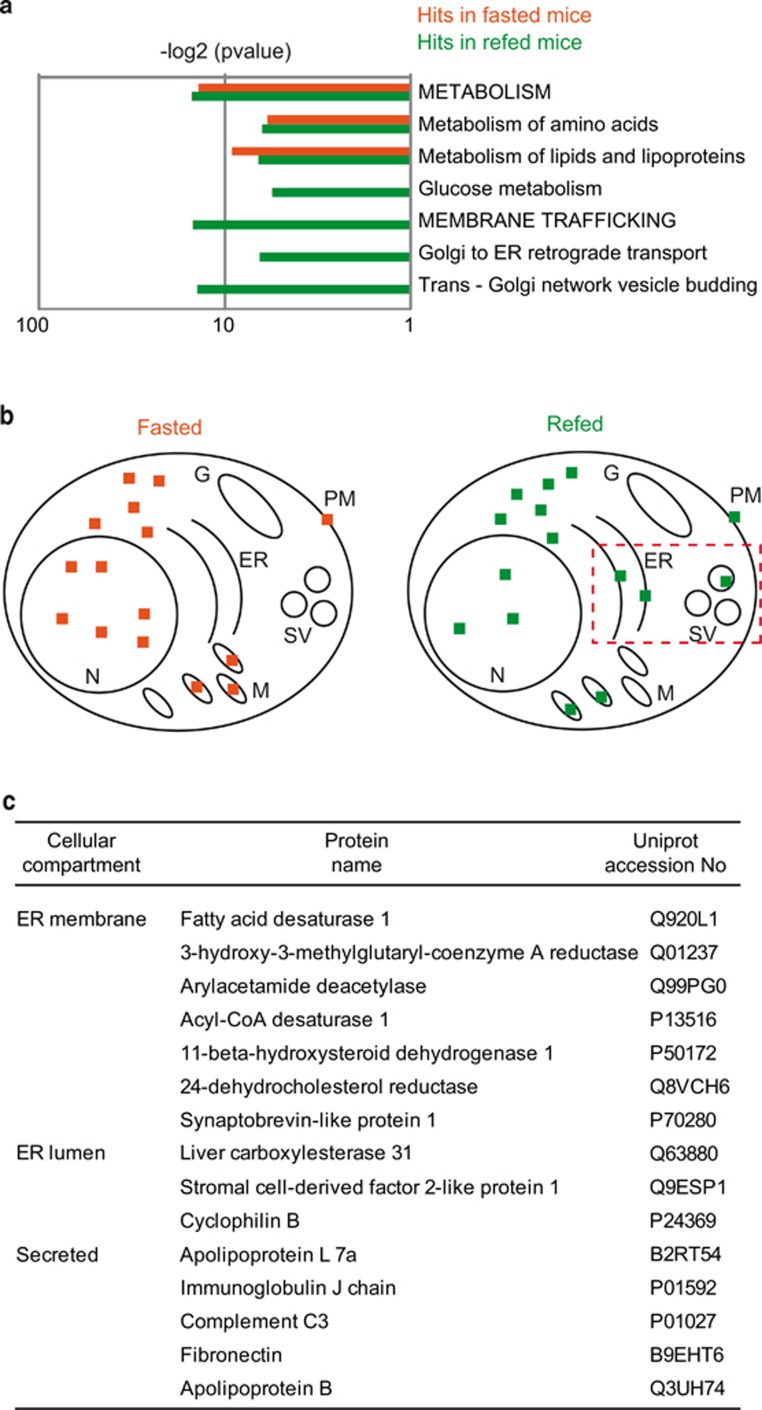
Figure 3.
Liver ubiquitome identifies ER-resident and secretory proteins. (a) Bar chart depicting the significance (P-value) for enriched indicated pathways/processes. Values for significantly enriched proteins in respective pathways/processes detected in the fasted (orange) or refed (green) livers. Only a selected group of pathways/processes is shown. A complete analysis is provided in Supplementary Figure S11C. −Log2 of P-values were used to indicate hits in fasted versus refed mice. (b) Graphical representation of differentially ubiquitylated proteins with respect to their localization in the indicated cellular compartments. Following compartments have been assigned to candidate proteins according to UniProt: nucleus (N), mitochondria (M), ER, Golgi (G) and secretory vesicles (SV), and plasma membrane (PM). Number of dots indicate the relative percentage of proteins localized to respective compartments (6.25% per dot, 16 dots in total). Proteins with unknown localization corresponded to 1 dot in both conditions. Red dotted rectangle highlights enrichment of hits at the ER and SV. (c) Table with cellular localization, protein name and UniProt number of all ER-resident and secreted proteins identified in refed mice

