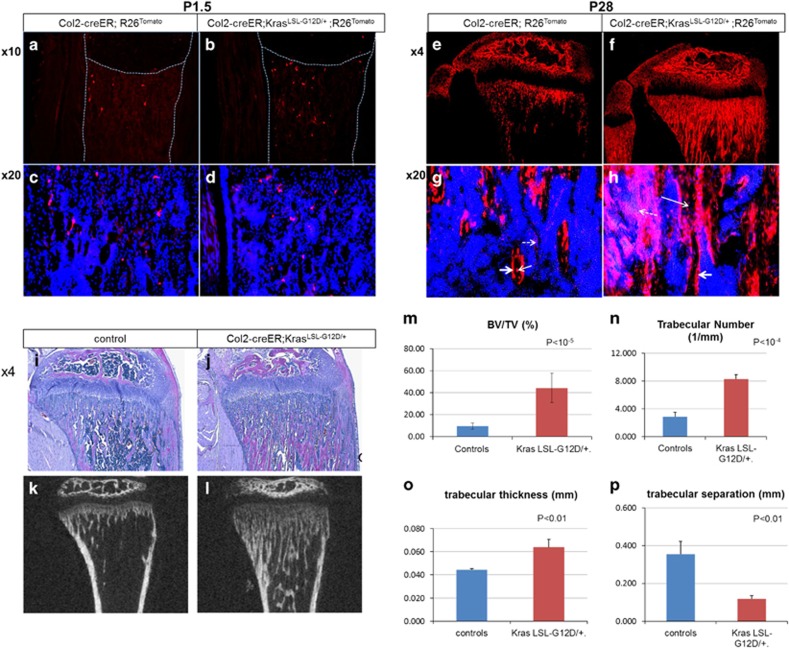
Figure 2.
Expression of KrasG12D in Col2-positive cells at E18.5 increases the number of their descendants and the trabecular bone mass (see also Supplementary figure S2). (a-d) Tomato-positive cells in the tibial metaphysis of Col2-creER;R26Rtomato mice with wild-type Kras (a, c) and KrasG12D (b,d) at P1.5. Mice were treated with tamoxifen at E18.5. A,B: × 4 magnification. c,d: × 20 magnification. Blue, DAPI; red, Tomato red fluorescent protein. Dotted lines indicate the borders of tibia. The middle dotted line indicates the border between growth plate and primary spongiosa (trabecular bone). Magnifications of primary spongiosa of a and b are shown in c and d respectively (n=3). (e-h) Tomato-positive cells in the tibial metaphysis of Col2-creER;R26Rtomato mice with wild-type Kras (e,g) and KrasG12D (f,h) at P28. The mice were treated with tamoxifen at E18.5. E,F: × 4 magnification. g,h: × 20 magnification. Blue, DAPI; red, Tomato red fluorescent protein; arrow: osteocytes; double arrow: osteoblasts; dotted arrow: stromal cells (n=4). (i-j) Hematoxylin/eosin-stained paraffin sections of tibias at P28 from Col2-creER mice with wild-type Kras (i) and KrasG12D (j) after Kras activation at E18.5 (× 4 magnification). Mice harboring KrasG12D show increased trabecular bone with a minimal effect in the growth plate structure (n=8). (k-l) MicroCT pictures of tibias at P28 from Col2-creER mice with wild-type Kras (k) and KrasG12D (l) after Kras activation at E18.5. (m-p) Graphs showing comparisons of bone volume fraction (m), trabecular number (n), trabecular thickness (o) and trabecular separation (p) measured by microCT in mice with wild-type Kras or KrasG12D at P28 (n=3 and n=4 for mutant and control groups, respectively)

