Figure 4.
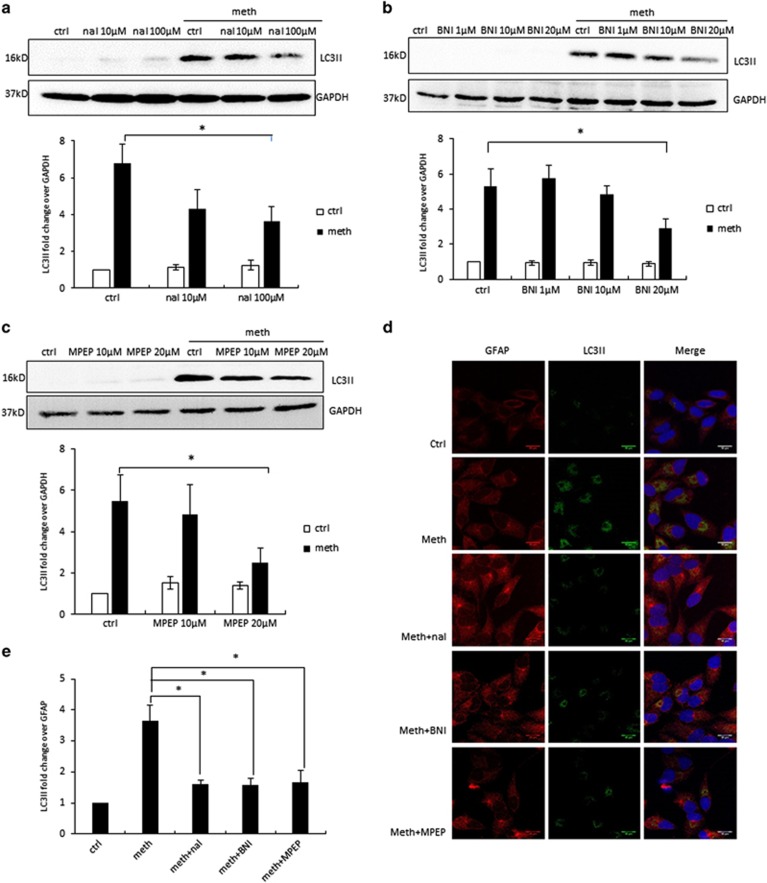
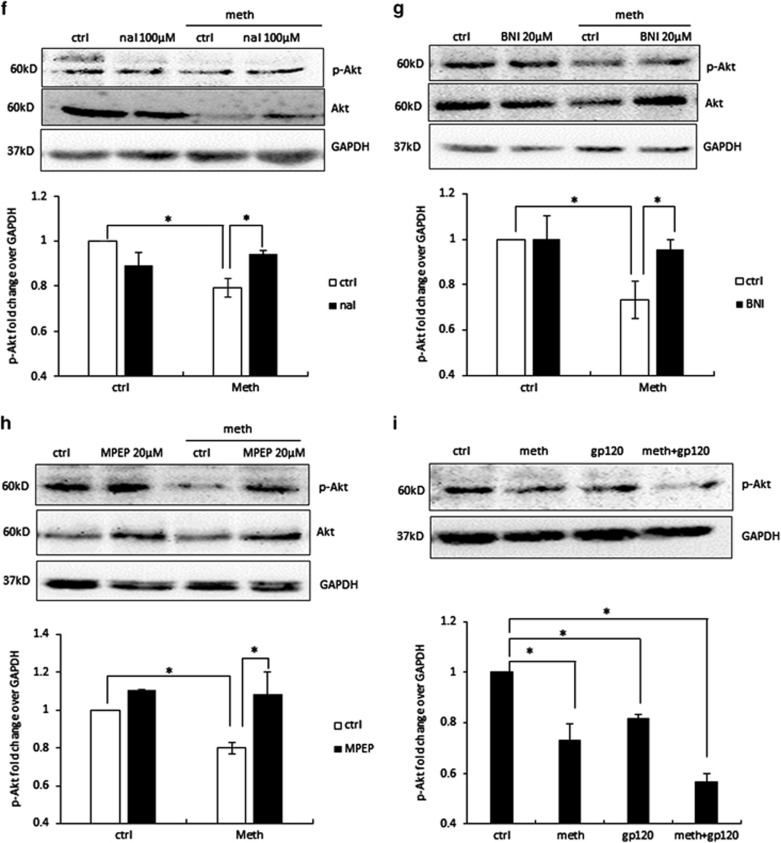
METH induces autophagy in astrocytes via opioid receptors and mGluR5 receptor. The results are shown as mean±S.E. from three independent experiments. Data from the western blot of LC3II (a–c) was quantified by AlphaEase FC software and are shown at the bottom of each panel. *P<0.05. For (f–i), cells were subject to western blot analysis with anti-Akt or anti-p-Akt antibody. (a) SVGA cells were treated with different concentrations of naltrexone, and then treated with 1 mM METH for 24 h. (b) SVGA cells were treated with different concentrations of nor-BNI, and then treated with 1 mM METH for 24 h. (c) SVGA cells were treated with different concentrations of MPEP, and then treated with 1 mM METH for 24 h. (d) SVGA cells were treated with or without naltrexone, nor-BNI, and MPEP, and then treated with 1 mM METH for 24 h. LC3II level was examined by confocal microscopy (scale bar, 20 μm). (e) Confocal microscopy data quantified by ImageJ software. (f) SVGA cells were treated with or without 100 μM naltrexone, and then treated with 1 mM METH for 24 h. (g) SVGA cells were treated with or without 20 μM nor-BNI, and then treated with 1 mM METH for 24 h. (h) SVGA cells were treated with or without 20 μM MPEP, and then treated with 1 mM METH for 24 h. (i) SVGA cells were treated with 1 mM METH and 400 pM gp120 IIIb for 24 h


