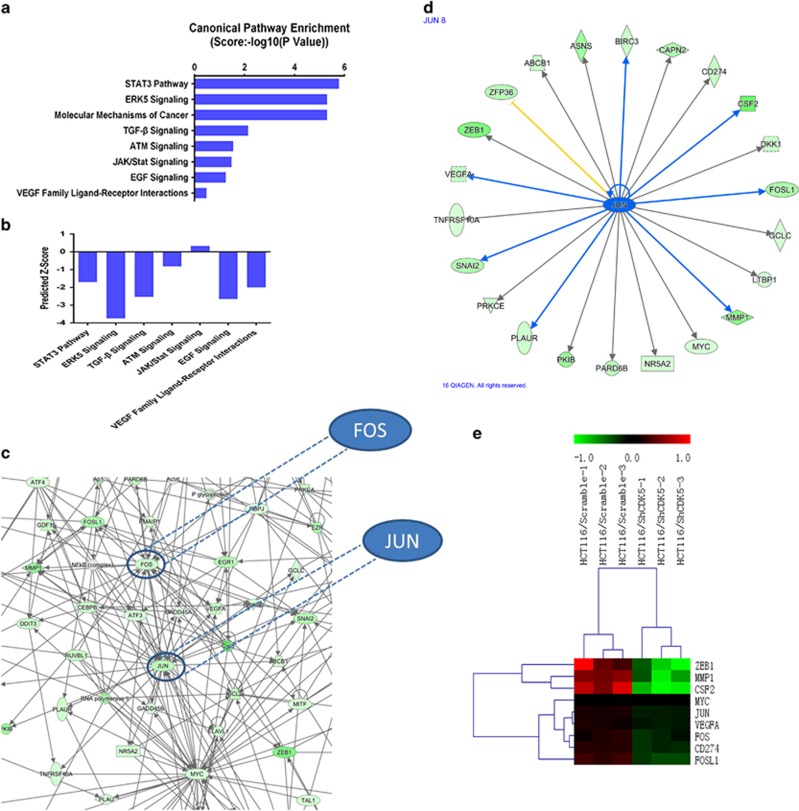
Figure 4.
Knocking down CDK5 downregulated a cluster of genes of the ERK5–AP-1 axis. (a and b) Canonical pathway enrichment of whole-genome expression microarray in CDK5 knocked down HCT116 cells was analyzed by IPA. Predicted activation state of each pathway was based on the regulation z-score (Increased: The z-score is ⩾2. IPA predicts that the process or disease will increase. Decreased: The z-score ⩽−2. IPA predicts that the process or disease will decrease). (c and d) Gene interaction network suggested a cluster of genes regulated by transcription factors FOS and JUN (In IPA database, JUN was used to represent transcription factor AP-1). (e) Heat-map analysis showed a cluster of AP-1-dependent genes regulated by CDK5 as indetified by microarray profiling

