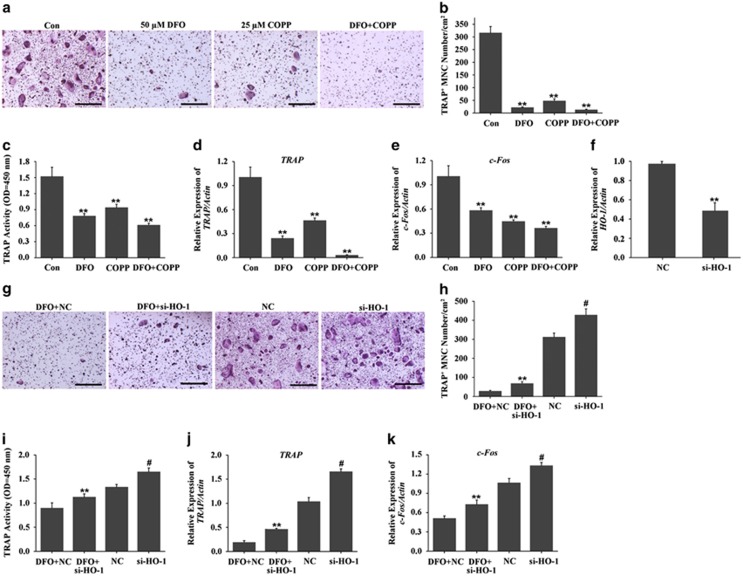
Figure 7.
HO-1 was involved in DFO-inhibited osteoclastogenesis. (a) TRAP staining was performed to observe the effect of HO-1 activation on DFO-inhibited osteoclast formation. Scale bars, 50 μm. (b) The number and area of TRAP-positive cells was counted. n=4, **P<0.01. (c) TRAP activity assessment was accomplished to observe the effect of HO-1 activation on DFO-inhibited osteoclast formation. n=4, **P<0.01. (d,e) qRT-PCR analysis of osteoclasts formation-specific genes TRAP and c-Fos in BMMs treated with DFO or/and COPP during osteoclastogenesis. n=4, **P<0.01. (f) Quantitative expression of HO-1 in the presence or absence of HO-1 siRNA treation. (g) TRAP staining was performed to observe depletion of HO-1 on DFO-inhibited osteoclast formation. (h) The number and area of TRAP-positive cells was counted. Scale bars, 50 μm. n=4, **P<0.01. # versus NC, #P<0.01. (i) TRAP activity assessment was accomplished to observe depletion of HO-1 on DFO-inhibited osteoclast formation. n=4, **P<0.01. # versus NC, #P<0.01. (j–k) qRT-PCR analysis of osteoclasts formation-specific genes TRAP and c-Fos in BMMs treated with DFO or/and si-HO-1 during osteoclastogenesis. n=4, **P<0.01. # versus NC, #P<0.01

