Figure 4.
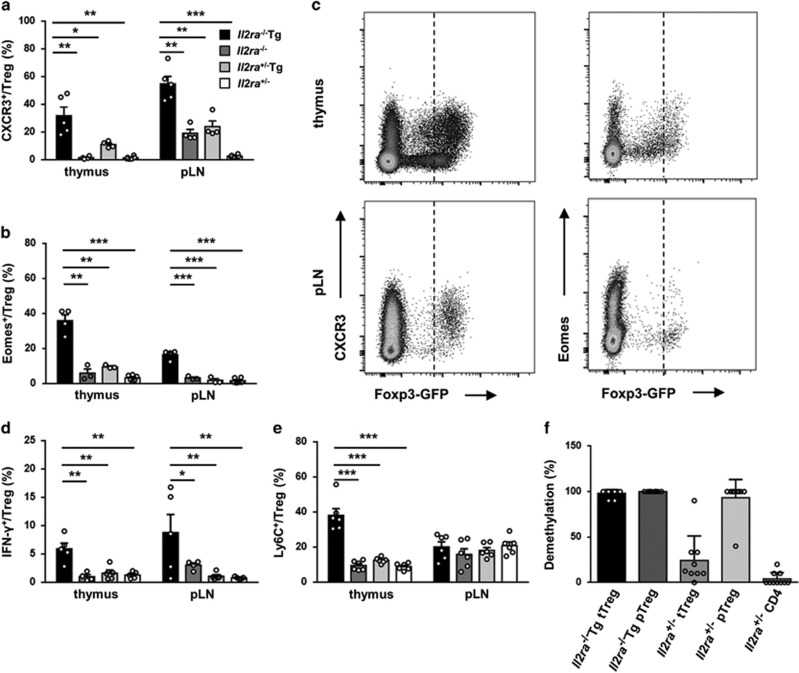
Treg cells are skewed to Th1-like stable phenotype in Il2ra−/−Tg mice. (a) Percentage of CXCR3+ Treg cells in thymus and pLN of Il2ra−/−Tg (n=5), Il2ra−/− (n=4), Il2ra+/−Tg (n=4) and Il2ra+/− (n=5) mice. (b) Percentage of Eomes+ Treg cells in thymus and pLN of Il2ra−/−Tg (n=4), Il2ra−/− (n=3), Il2ra+/−Tg (n=3) and Il2ra+/− (n=6) mice. (c) Representative flow cytometry result of Foxp3 and CXCR3, Eomes expression on CD4+CD8− T cells from thymus and pLN of Il2ra−/−Tg and control mice. (d) IFN-γ secreting ability of thymus and pLN Treg cells from Il2ra−/−Tg (n=5), Il2ra−/− (n=4), Il2ra+/−Tg (n=5) and Il2ra+/− (n=5) mice. (e) Ly6C expression of thymus and pLN Treg cells from Il2ra−/−Tg (n=6), Il2ra−/− (n=6), Il2ra+/−Tg (n=6) and Il2ra+/− (n=6) mice. (f) Percentage of Foxp3 TSDR CpG demethylation of thymus and spleen/pLN Treg cells from Il2ra−/−Tg and Il2ra+/− mice. Data are shown in mean±S.E.M. *P<0.05, **P<0.01, ***P<0.001. (Student's t test)

