
Figure 5.
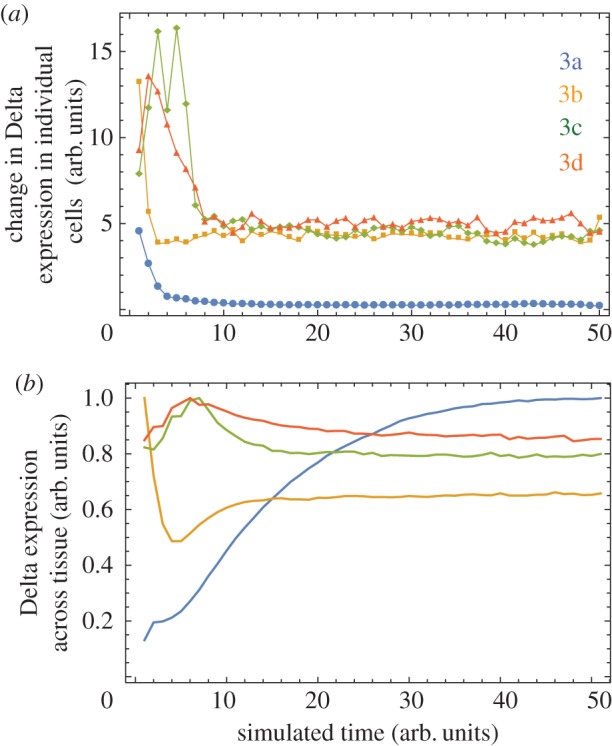
Quantifying pattern stability across simulations used for figure 3a–d. (a) The change in the Delta expression of individual cells between time intervals of 1 arb. units in the simulation. The change is calculated as the Euclidian distance between the normalized N × N matrices holding the Delta expression for all cells in the hexagonal lattice, from time T to time T + 1. In this way, panel (a) is a quantification of the change in Delta expression in individual cells over time. (b) Mean Delta expression across the tissue over time. This is computed by averaging the Delta expression across cells in the hexagonal lattice (tissue) at each time step. In this way, panel (b) provides a quantification of the overall pattern density over time. Each line shown is averaged over 10 independent simulations.