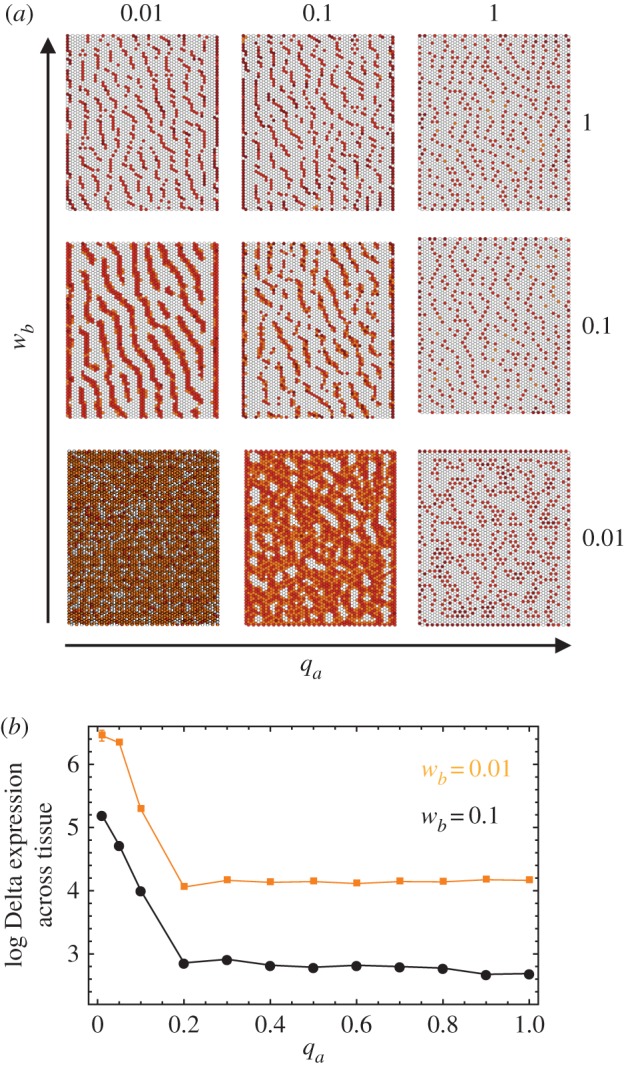
Figure 6.

Varying wb and qa. (a) The resulting pattern for different (wb, qa) pairs and assuming that wa = 1 and qb = wb. (b) The log of the tissue average Delta expression against qa for wb = 0.1 and wb = 0.01. The pattern becomes more dense for smaller qa and wb, in agreement with the qualitative picture in (a). Additional parameter values and baseline parameters common across simulations are detailed in table 1 and in the Methods section. Colour scheme: white, D < 0.005; orange, 0.005 < D < 0.05; light brown, 0.05 < D < 0.5; dark brown: D > 0.5. The values of Delta (D) used for the colour scheme were normalized by dividing across by the maximum Delta value for any given expression matrix.
