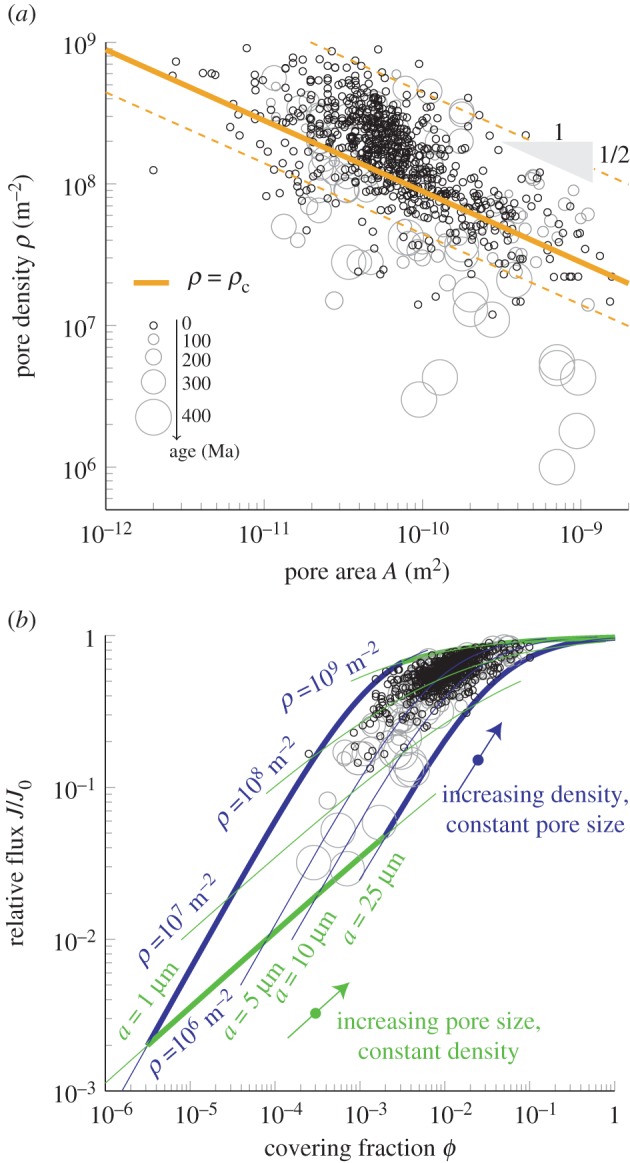
Figure 3.

Relationship between stomatal characteristics and leaf gas exchange capacity. (a) Stomatal density ρ decreases with increasing pore area A, but the capacity for gas exchange is relatively constant. Data point size reflects age (largest circles 395 Ma, smallest circles 0 Ma). The data are well described by the density law represented by the solid line (equation (2.4), with h = 0.5 mm (see Material and methods)), except species older than 325 Ma. The triangle illustrates the power-law-function  . The dashed lines illustrate predictions of equation (2.4) with boundary layer thickness h = 0.1 mm (top) and h = 1 mm (bottom). (b) Dependence of the relative flux J/J0 on exposed covering fraction ϕ = ρA. Lines indicate J/J0 along traces of constant pore density ρ and radius a. Circles indicate species age using symbols from panel (a).
