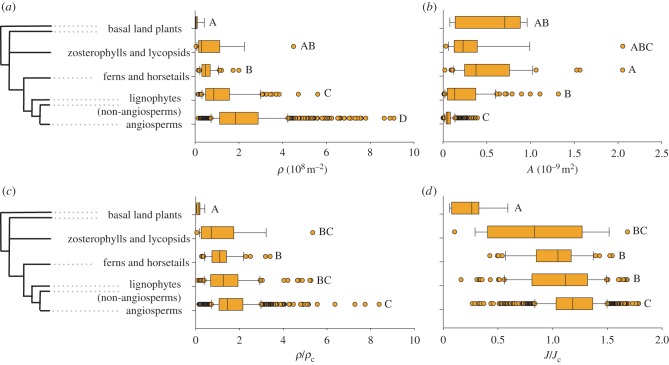
Figure 5.
Box and whisker graph of the phylogenetic distribution of (a) stoma density ρ, (b) stoma pore area A, (c) relative stomatal density ρ/ρc, and (d) relative flux J/Jc across the leaf surface. Central line indicates the distribution median; 50% of the data points are inside the box and 95% are inside the whiskers. Circles indicate outliers. Uppercase letters indicate homogeneous groups (Games–Howell method). (Online version in colour.)

