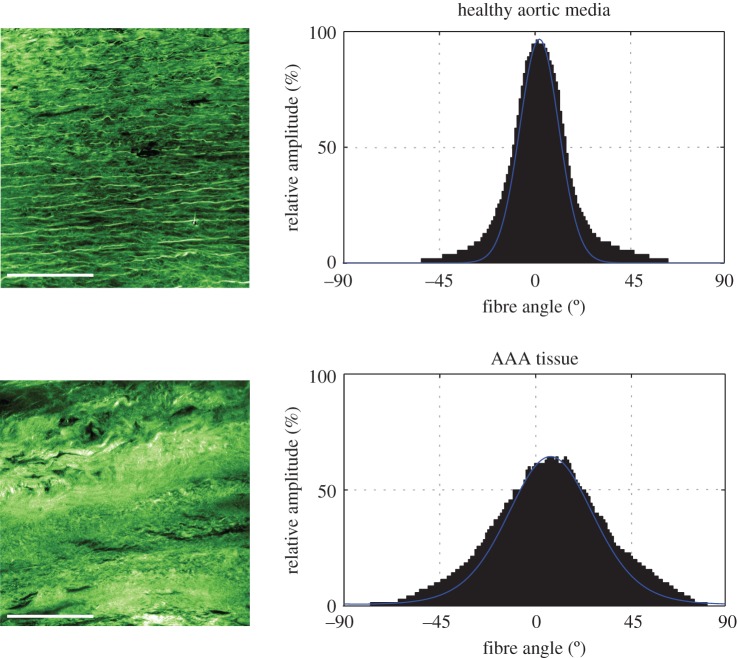
Figure 1.
Representative SHG images of the collagen structure in a healthy abdominal aortic media (above) and an AAA tissue taken from the middle portion of the wall thickness (below). Corresponding graphs show the angular dispersion (relative amplitude in %) of collagen fibre orientations, which is narrower for a healthy aortic media (smaller dispersion of fibres), when compared with AAA tissue (higher fibre dispersion). Scale bar, 100 µm. (Online version in colour.)

