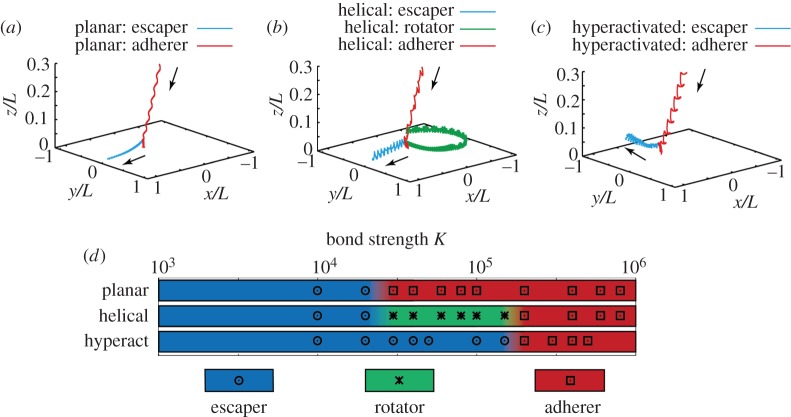
Figure 5.
The computed trajectories of the sperm head–tail junction for the three low-viscosity waveforms depicted in figure 2b, together with a summary of the long-time sperm behaviour for the different waveforms as the bond strength is varied. (a) Trajectories for a sperm with the planar waveform, beat pattern I of figure 2b, with a bond strength of K = 104 (escaper) and K = 105 (adherer). (b) Trajectories of sperm with the helical waveform, pattern II of figure 2b, for three different bond strengths: K = 104 (escaper), K = 105 (rotator) and K = 106 (adherer). (c) Trajectories of the sperm with the hyperactivated waveform, pattern III of figure 2b, for bond strengths of K = 105 (escaper) and K = 106 (adherer). (d) The long-time behaviour of sperm is depicted by colour for each of the given beat patterns (I, planar; II, helical; or III, hyperactivated) and for a spectrum of bond strengths, with the regions between the different final cell behaviours illustrated by a transition of the colours. In particular, these transitions simply reflect that the long-time behaviour changes somewhere in this region, because only a discrete number of bond strengths have been simulated.

