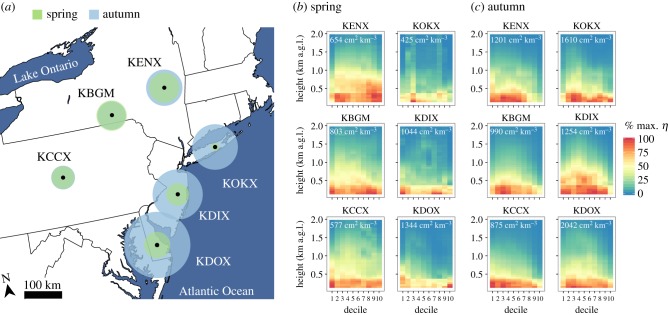
Figure 1.
(a) WSR-88D locations (black dots). Green (spring) and blue (autumn) disk radius represents the seasonal average of migratory activity (η; cm2 km−3) as a summation of time and space (i.e. summed η values of b and c). (b) Spring and (c) autumn spatial and temporal distribution of η. To use a common gradient of intensity, measures are represented as the percentage maximum for each season–radar pairing. Height intervals were averaged to 50 m intervals to enable visualization.

