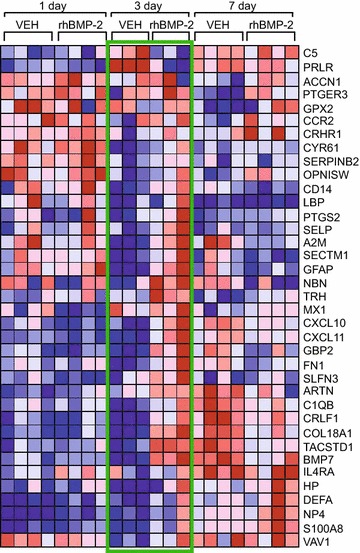
Fig. 3.

Microarray analysis indicates that rhBMP-2 induces many genes involved in neuroinflammation in the DRG. Heat map showing genes whose expression was altered at 1, 3 and 7 dps in the ipsilateral L4/L5 DRGs of rhBMP-2/ACS or vehicle/ACS implanted rats. Blue color intensity indicates decreasing transcript expression as compared to the mean value across all samples. Red color intensity indicates increasing transcript expression as compared to the mean value across all samples. The green outlined panel indicates high significant differences at 3 dpi. Each column represents data from RNA extracted from one rat
