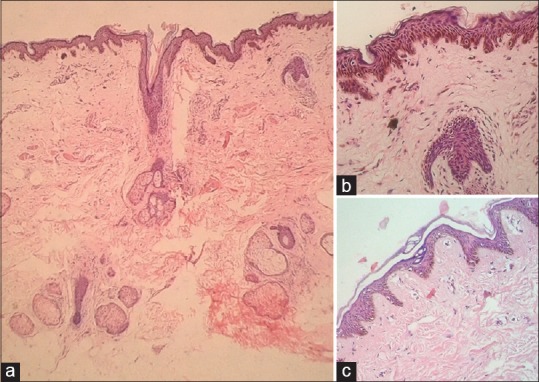
Figure 5.

(a) Hematoxylin and eosin (H and E, ×20): scanner view showing lentigenous hyperplasia of rete with uniformly increased melanin in the basal layer with upper dermal fibroplasia and scattered melanophages without much inflammatory infiltrate. (b) (H and E, ×100) : Presence of epidermal hypermelanosis, few large melanocytes, a thickened granular layer, and upper dermal fibroplasia and scatter of melanophages. (c) (H and E, ×20): mild hyperplasia of rete with mildly increased melanin in the basal layer. No dermal inflammation or melanophages
