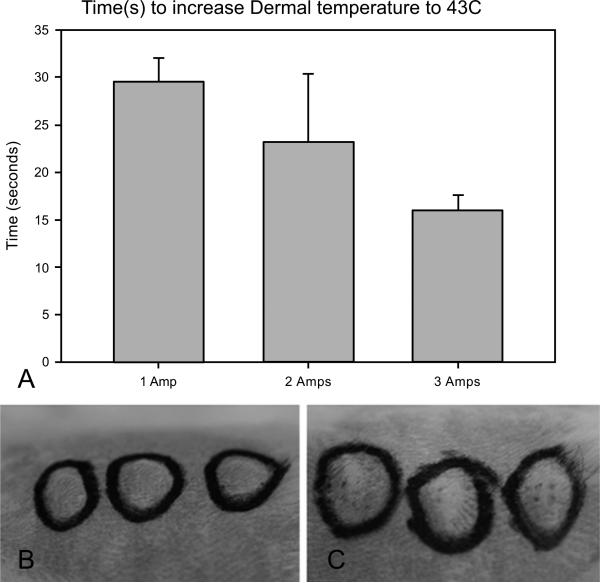
Fig. (3).
Thermal Application Timing and Effect on Skin. (A) Comparison of various laser amperages and the time necessary to increase intradermal skin temperature to 43°C. Error is represented as standard deviation (SD). (B) Evaluation of tissue damage by visual analysis after application of heat and prior to pulsing. (C) Evaluation of tissue damage by visual analysis after application of heat and after pulsing.

