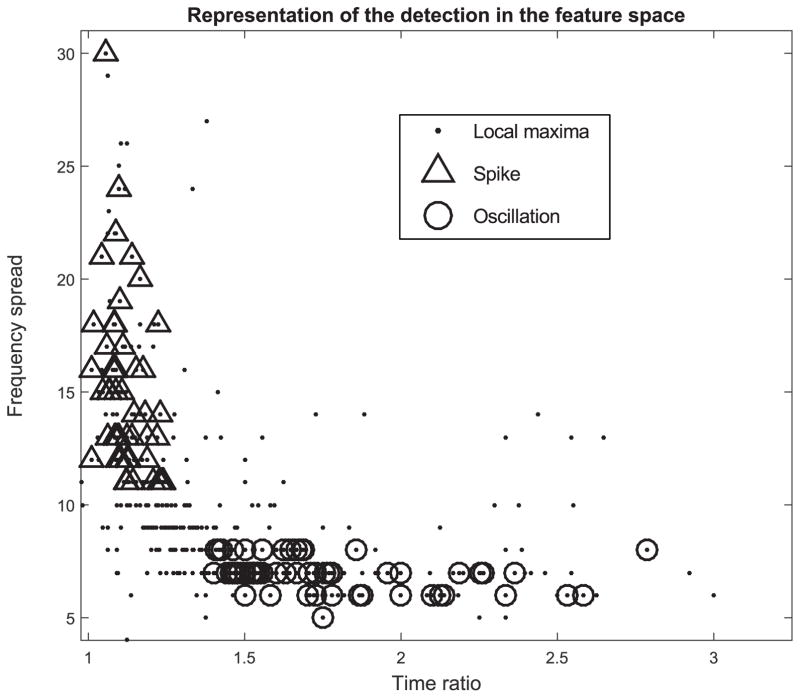
Fig. 10.
Representation of the local maxima in the feature space. The time ratio in the x-axis corresponds to the Full Width at Half Maximum (FWHM) in time of the island relative to the local maxima compared to the width of the impulse response at the same frequency. The frequency spread in the y-axis is calculated in the TF image as the FWHM in frequency of the island relative to the local maxima. The black dots represent all the local maxima above the threshold. The triangles, and the circles are the local maxima that were labeled as spikes and oscillations respectively.

