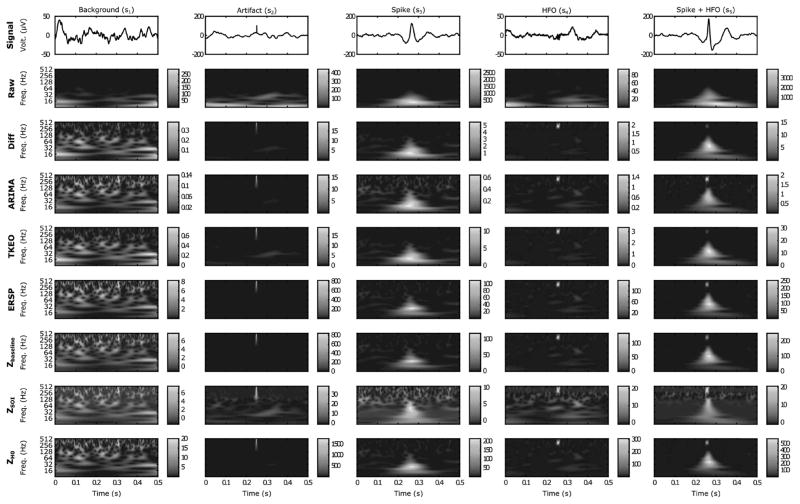
Fig. 2.
Examples of the 5 types of simulated events in time and time-frequency domains. The events are represented in a 500 ms-windows. The columns correspond to an event type, the first line shows the time-series, and the other lines illustrate the result of each method in the TF map. The HFOs were generated with an SNR of 10 dB. Each colormap was normalized between the minimum and maximum value of the image. As expected, the HFOs are not visible in the raw TF representation but appear in the whitened signal. Note how the ZSOI alters the images, especially the spike and the HFO.

