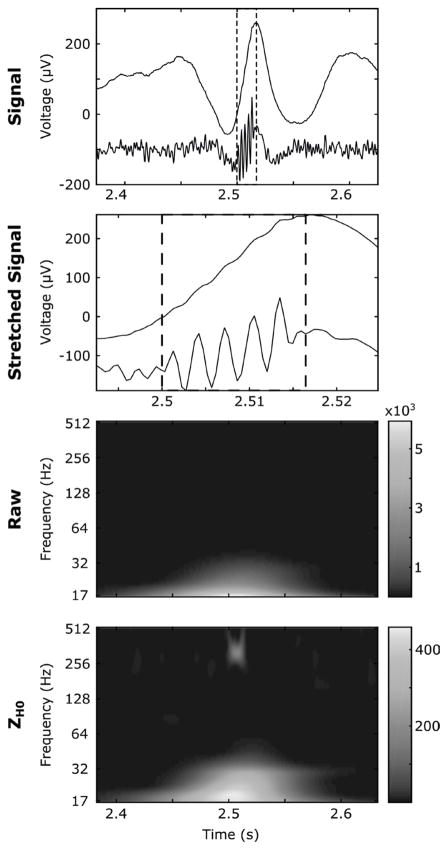
Fig. 8.
An example of a simulated Fast-Ripple (FR) occurring during a sharp transient. The box with dashed lines delineate the FR. The first line corresponds to the time course of the raw (above) and the ZH0 whitened reconstructed signal (below.) The second line is a stretched version of the first line. The third and fourth lines are the raw and ZH0 TF maps relative to the first line respectively. This HFO is hardly distinguishable in the time and TF domain on the original data. It is however evident in the ZH0 frame and whitened reconstructed signal. Note that the spike is still present in the whitened reconstructed signal.

