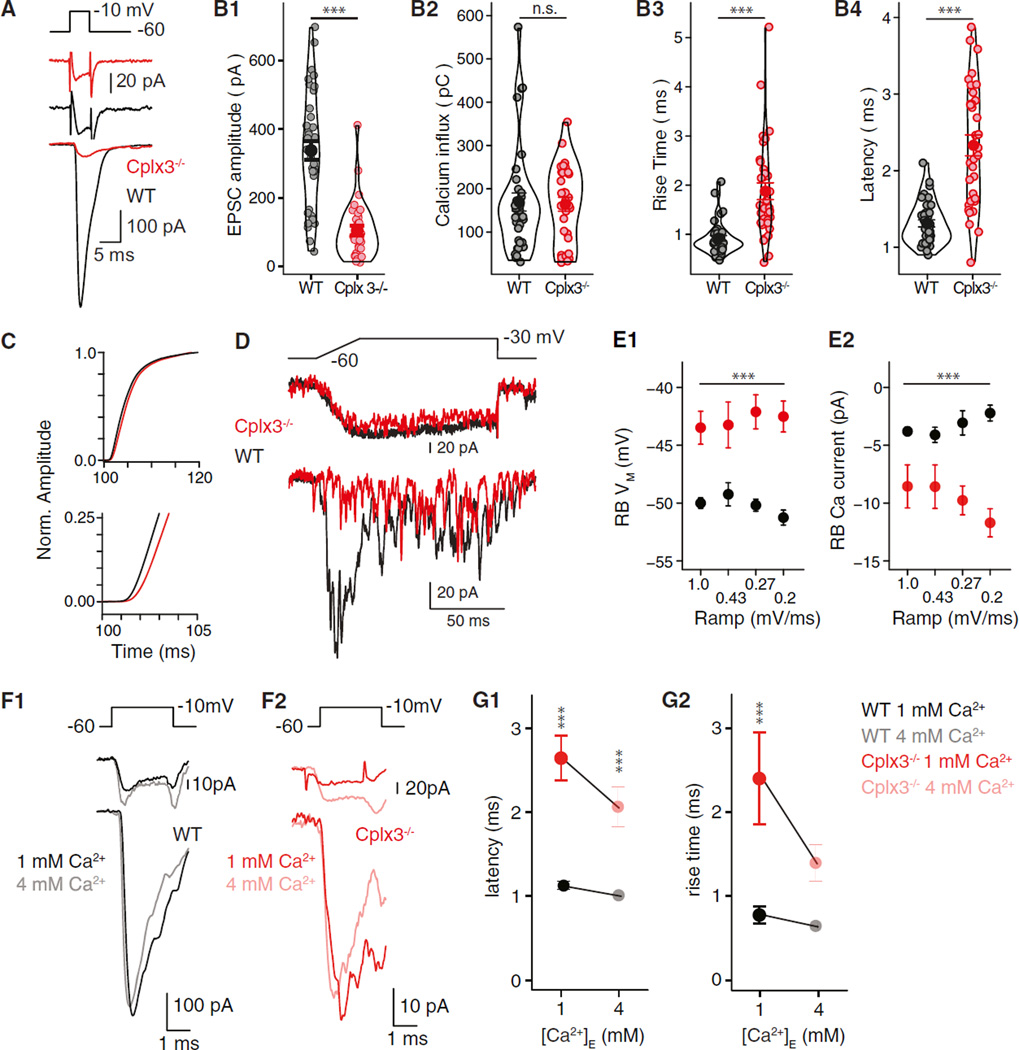
Figure 1. Reduced Phasic Release from Cplx3−/− RBs.
(A) Depolarization of RBs (top) elicits RB ICa (middle) and evokes EPSCs in AIIs (bottom) in WT (black) and Cplx3−/− (red) retina.
(B1–B4) From left: EPSC amplitudes in Cplx3−/− reduced significantly (WT versus Cplx3−/−: 338 ± 28 versus 104 ± 14 pA; n = 36 versus 30; p < 0.0001), but RB Ca2+ influx (integrated ICa) was unaffected. EPSC rise times and latencies increased in Cplx3−/−. The width of outlines around data points represents distribution density.
(C) Integrated EPSCs, normalized (Norm.) to value 20 ms after stimulus onset, illustrate a slowed-release process in Cplx3−/−.
(D) RB voltage ramps evoke transient and then desynchronized EPSCs in WT. Transient component is almost abolished in Cplx3−/−, but desynchronized events persist.
(E1 and E2) Higher RB VM threshold for exocytosis in Cplx3−/−; first release event is observed at larger RB ICa.
(F1 and F2) Increasing [Ca2+]E while reducing [Bapta]I does not increase EPSC amplitude at either WT or Cplx3−/− synapses; larger RB ICa in elevated [Ca2+]E.
(G1 and G2) Elevated [Ca2+]E decreased EPSC latency (left) and rise time (right) in Cplx3−/− but not WT; a relative delay persists in Cplx3−/− (WT versus Cplx3−/−: 0.98 versus 2.1 ms; n = 7 versus 6; p = 0.016).
Error bars indicate SEM. We used Student’s t test for means in (B), two-way ANOVA for means in (E), and two-way ANOVA with Tukey’s honestly significant difference (HSD) post hoc test for (G). **p ≤ 0.01; ***p ≤ 0.001; n.s., not significant.

