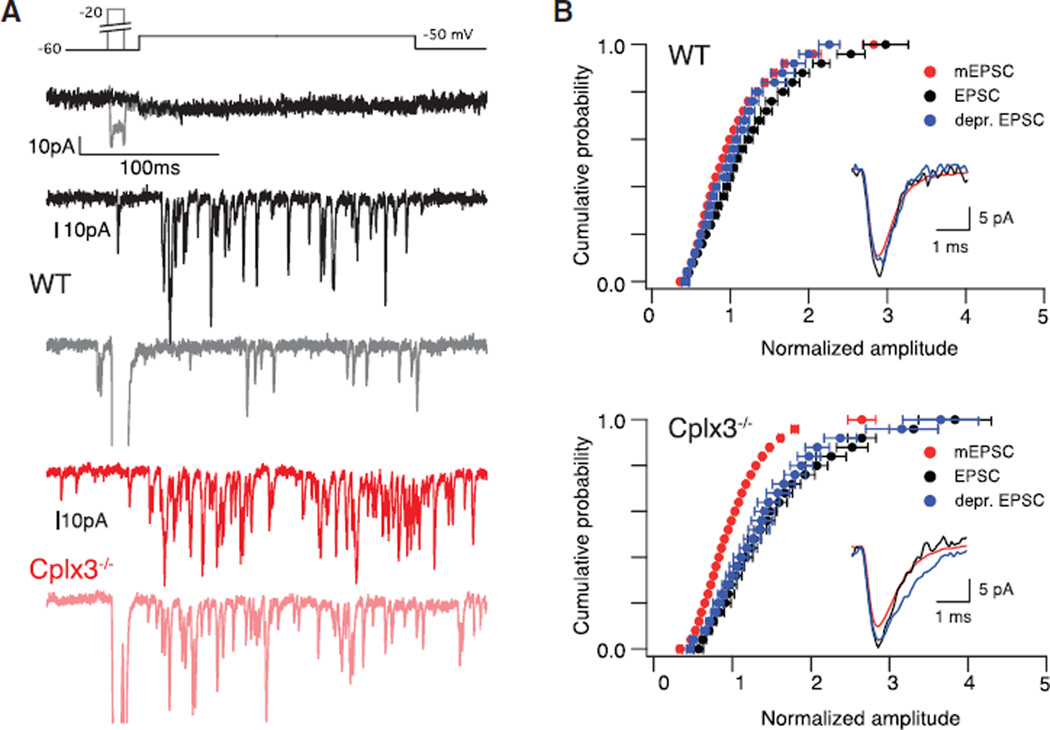
Figure 3. Coordinated MVR from Cplx3−/− RBs.
(A) Voltage steps to −50 mV elicit small RB ICa (top) and evoke desynchronized EPSCs. Prepulse to −20 mV reduces EPSC frequency and amplitude in WT (gray versus black) but not Cplx3−/− (light versus dark red). Stronger presynaptic depolarization used for Cplx3−/− because of elevated RB voltage threshold for exocytosis; see Figure 2D.
(B) Cumulative probability distributions of EPSC amplitudes (red indicates mEPSCs; black indicates control evoked EPSCs; blue indicates evoked EPSCs after pre-pulse) illustrate MVR (n = 8 WT; n = 11 Cplx3−/−). Evoked EPSCs and mEPSCs exhibited identical time courses (inset; rise time evoked EPSC versus mEPSC: 0.32 ± 0.01 versus 0.32 ± 0.01 ms for WT and 0.36 ± 0.01 versus 0.34 ± 0.02 ms for Cplx3−/−). Evoked EPSC amplitude reduced to quantal level by pre-pulse in WT but not Cplx3−/− (WT: p = 0.008; Cplx3−/−: p = 0.8; dependent Wilcoxon signed-rank test). Error bars indicate mean ± SEM.

