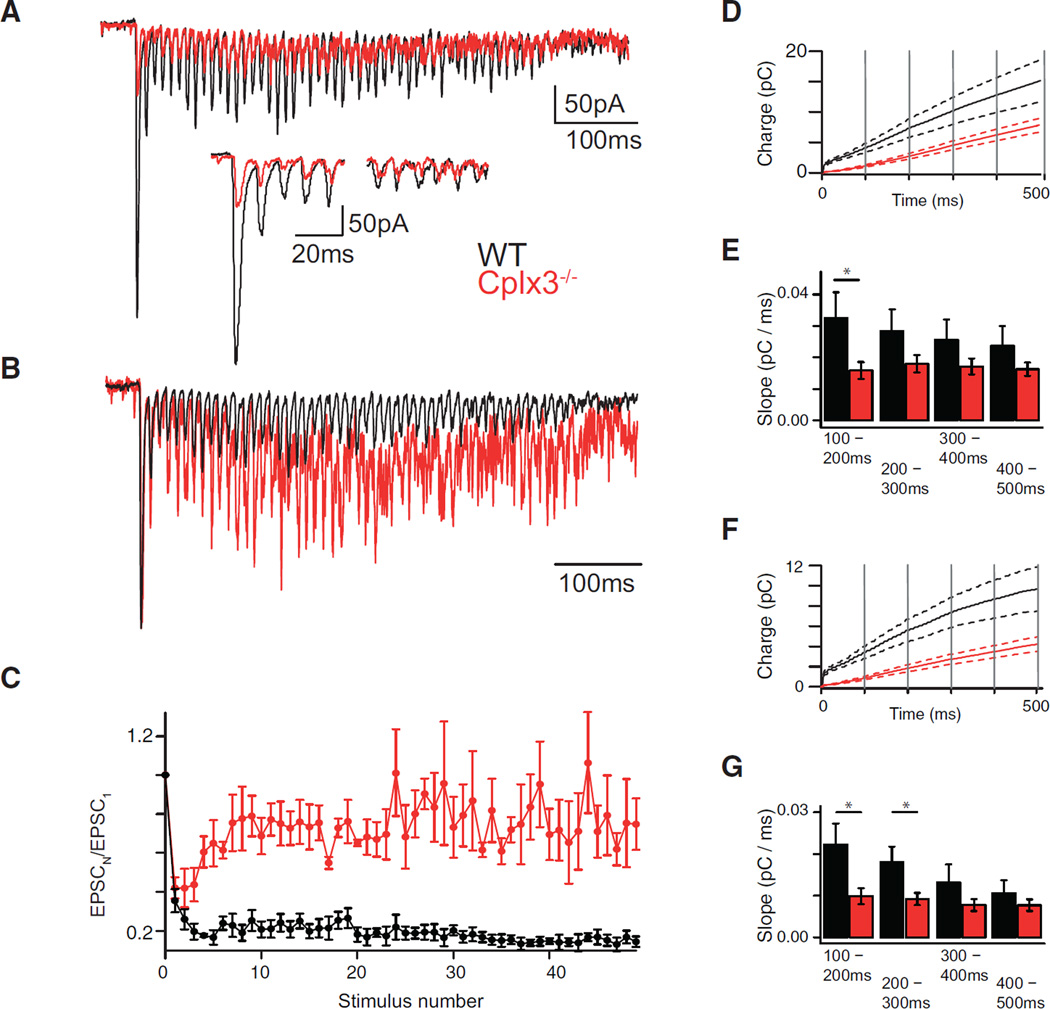
Figure 4. Use-Dependent Plasticity at RB → AII Synapses.
(A and B) Depolarization train (3 ms to −10 mV at 100 Hz) evokes EPSCs in AIIs at WT (black) and Cplx3−/− (red) synapses. EPSC amplitudes depressed strongly during train (inset: first five and final five responses), but magnitude and timing of depression varied between WT and Cplx3−/−, with Cplx3−/− showing recovery to a larger steady-state level (relative to the initial response, shown in B; EPSCs normalized to first response amplitude).
(C) Normalized amplitudes plotted against stimulus number.
(D and E) Integrated EPSCs divided into 100-ms bins (vertical gray lines). Solid lines indicate averages (WT, n = 5; Cplx3−/−, n = 8), and dotted lines indicate SEM. Average slopes of each bin show initial recovery rate in WT synapses, but not Cplx3−/− synapses, slowed with time (one-way repeated-measures ANOVA; WT versus Cplx3−/−: F(3, 12) = 6.971, p < 0.01; versus F(3, 21) = 1.337, p > 0.05), with the most pronounced differences observed in the 100–200 ms window (WT versus Cplx3−/−: 0.033 ± 0.008 versus 0.016 ± 0.003 pC/ms, p = 0.039, Student’s t test).
(F and G) Same as in (D and E), but for phasic component alone (note smaller current integral values). WT data, but not Cplx3−/− data, were reduced in slope as sections advanced (one-way repeated-measures ANOVA; WT versus Cplx3−/−: F(3, 12) = 17.17, p < 0.001; versus F(3, 21) = 2.891, p > 0.05), and post hoc analysis using Student’s t test with a Bonferroni-Holm correction showed different slopes at 100–200 ms (WT versus Cplx3−/−: 0.022 ± 0.005 versus 0.009 ± 0.002 pC/ms; p = 0.04512) and 200–300 ms (WT versus Cplx3−/−: 0.018 ± 0.004 versus 0.002 ± 0.001 pC/ms; p = 0.0459). As in (E), recovery of phasic transmission is slowed more than that of transmission generally (including asynchronous release).
Data are presented as mean ± SEM. *p < 0.05.

