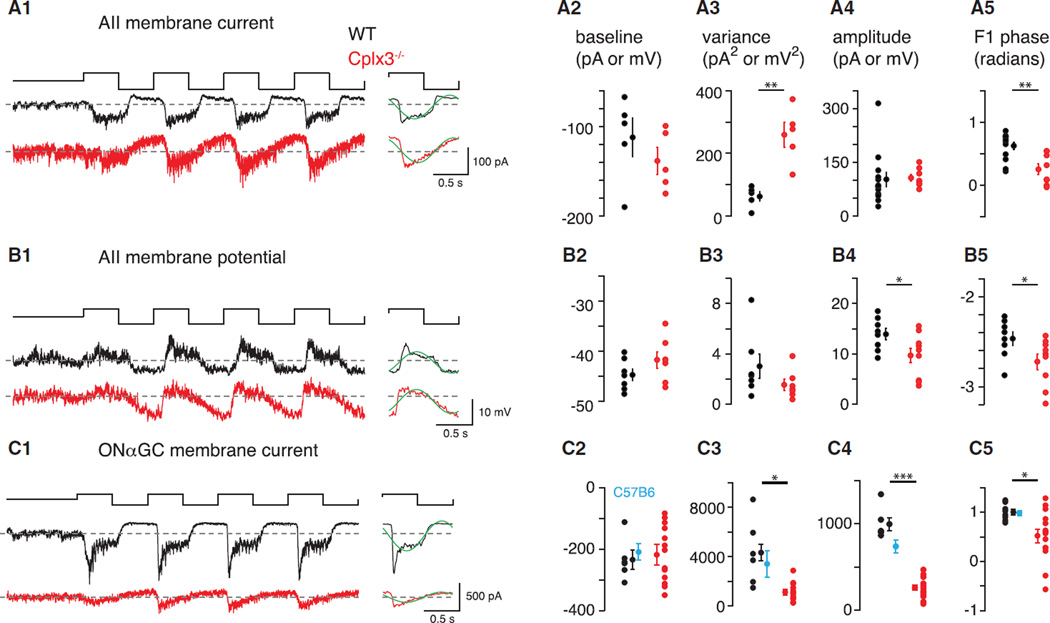
Figure 5. Cplx3−/− Slows and Attenuates Propagation of Rod-Mediated Signals through the RB → AII Circuit.
(A1–A5) In (A1, left): IAII (VHOLD = −70 mV; 1 kHz sampling) during 100% contrast modulation (mean = 10 R*/rod/s) in Cplx3−/− and WT retinas. In (A1, right): average of last three cycles, binned at 100 Hz, with F1 Fourier component superimposed (green). (A2) Baseline current during mean luminance in both groups; mean ± SEM shown next to individual data points. (A3) IAII variance measured over 2 s during mean luminance. (A4) Peak-to-peak amplitude of the binned, averaged response cycle (see A1, right). (A5) Phase of F1 Fourier component (see A1, right). (A2–A5) n = 5–13 in WT and 5–8 in Cplx3−/−.
(B1–B5) Same as in (A1–A5) for AII VM (current-clamp recording). Average VM measured over four cycles (B1) was depolarized significantly in the Cplx3−/− retina (−42.3 ± 1.6 versus −45.8 ± 1.1 mV in WT; p < 0.05, one-tailed Student’s t test). (B2–B5) n = 7–8 in WT and 7–9 in Cplx3−/−.
(C1–C5) Same as in (A1–A5) for IGC (VHOLD =−70 mV). (A2–A5) n = 6–8 in WT and 14 in Cplx3−/−. Cplx3+/+ WT littermate controls were similar to C57B6 WT controls (n = 6; cyan).
Data are presented as mean ± SEM. *p < 0.05; **p < 0.002; ***p < 0.0001.

