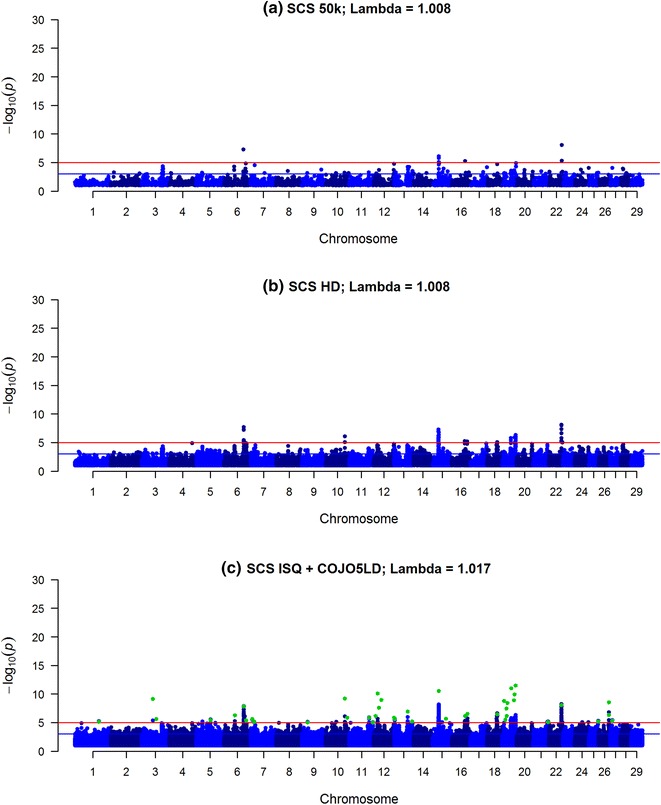
Fig. 2.

Manhattan plot for somatic cell score (SCS) using Bovine 50k (a), BovineHD (b) and ISQ data and variants after selection (COJO5LD in green) (c). Significance of variants effects (−log10(p)) based on the GCTA single variant analyses for somatic cell score (SCS) using Bovine 50k (a), BovineHD (b), and full sequence data (ISQ) and the variants selected after the COJO5LD analysis (green) (c)
