
Figure 4.
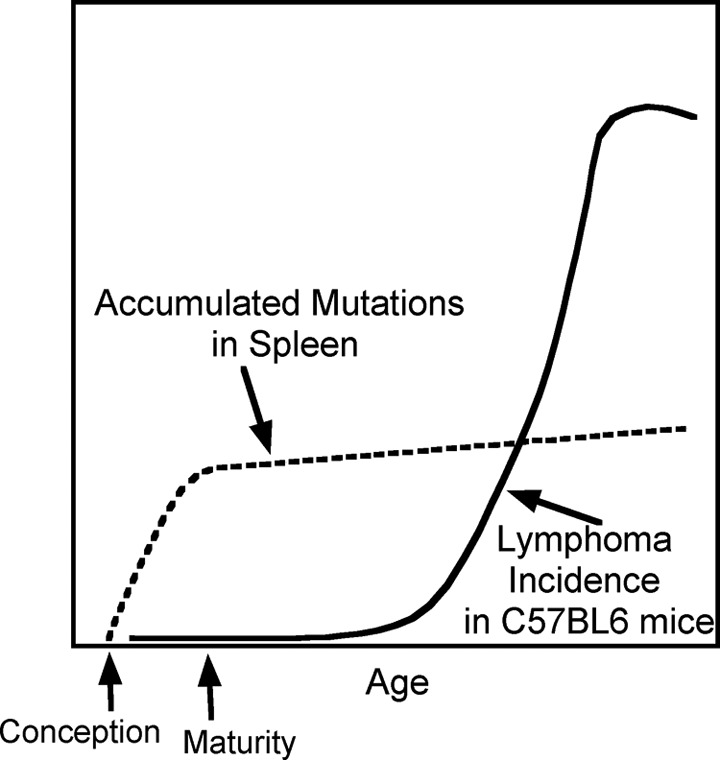
Comparison of the time courses of mutation accumulation with onset of malignancies in the hematopoietic system in mice. Stylized curves represent the numbers of mutations detected in spleens (dashed line) and lymphoma incidence (solid line) in C57BL/6 mice. Data from DeGregori.32