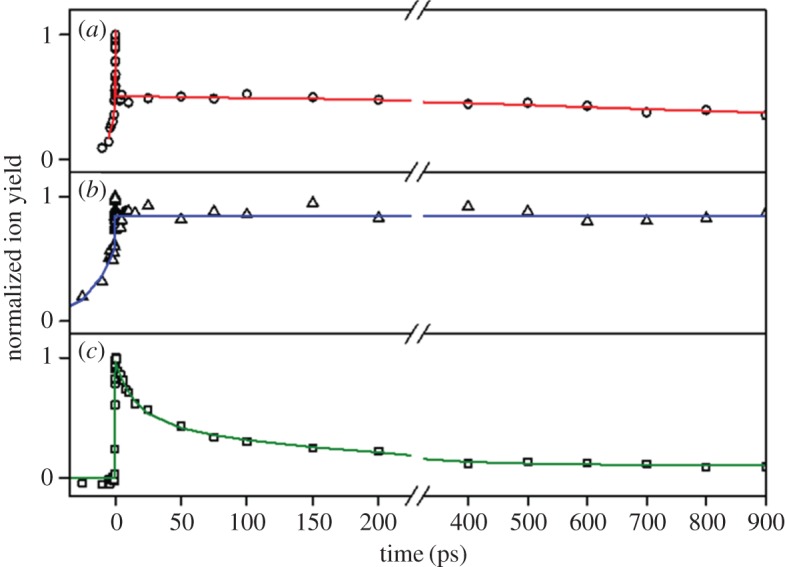
Figure 16.

TR–IY (hollow points) and associated kinetic fits of (a) MVP, (b) ConA and (c) EF. Each molecule was excited at the S1 origin and probed with 200 nm light. Data collected by Rodrigues et al. Reproduced with permission from reference [140]. (Online version in colour.)
