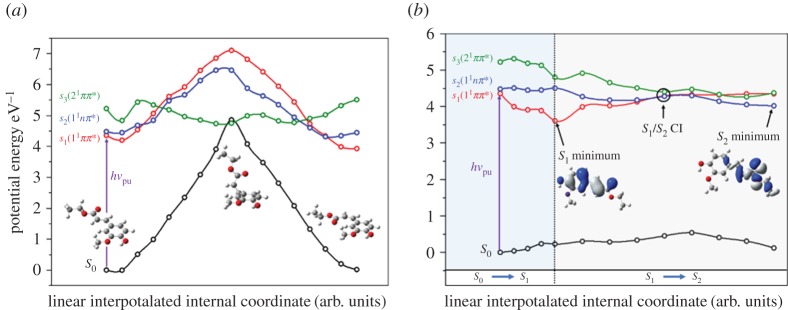
Figure 17.
Results of the computational work by Rodrigues et al. (a) Potential energy cuts (PECs) of the S0 (black line), S1(11ππ*) (red line), S2(11nπ*) (blue line) and S3(21ππ*) (green line) states of EF along the E/Z isomerization coordinate are shown. Optimized ground state geometries for each isomer and at the S0/S3 conical intersection (CI) are also presented. (b) PECs of the S0 (black line), S1(11ππ*) (red line), S2(11nπ*) (blue line) and S3(21ππ*) (green line) states of EF along linearly interpolated internal coordinates (LIICs). The blue and grey shaded areas represent the S0 to S1 and S1 to S2 (via S1/S2 CI) LIICs, respectively. Optimized geometries and molecular orbitals for the S1 and S2 states are also presented. Reproduced with permission from reference [140]. (Online version in colour.)

