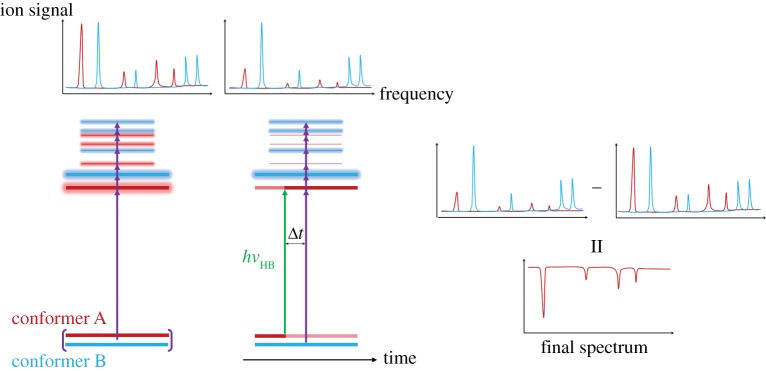
Figure 8.
Schematic of HB spectroscopy. The HB laser creates a population hole in the ground state of one of the conformers, so that its contribution to the R2PI spectrum is decreased. Subtracting the total R2PI spectrum from the HB spectrum, therefore, yields the isolated contribution from the selected conformer in the form of negative peaks. Multiple headed purple arrows denote the wavelength scanning of the hνpu laser pulse. Various detection techniques (ionization, fluorescence, etc.) can be used. (Online version in colour.)

