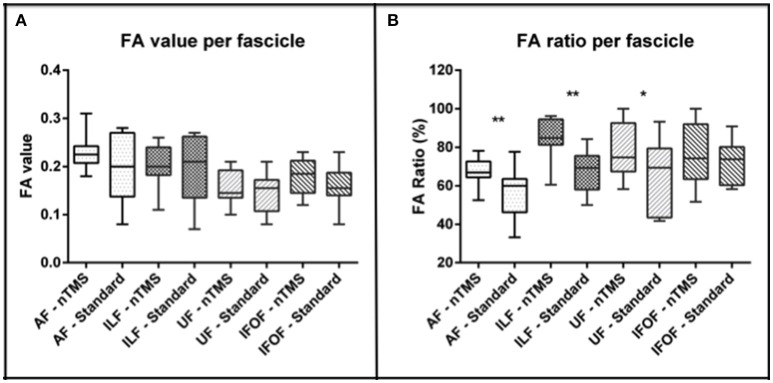
Figure 2.
Analysis of the FA value and ratio of each computed fascicle by using the nTMS strategy vs. the standard atlas-based technique. (A) A trend toward an increase of FA values was observed by using the nTMS-based technique. (B) The FA ratio used for the nTMS-based DTI-FT was higher for each fascicle as compared to the standard technique. The difference was significant for AF (**p = 0.006), ILF (**p = 0.002), and UF (*p = 0.04).

