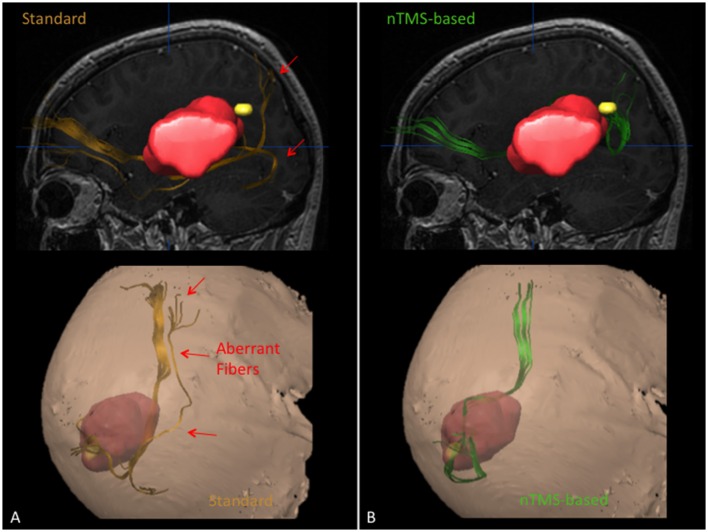
Figure 3.
Case example showing the ability of the nTMS strategy to reduce the visualization of aberrant/false positive fibers as compared to the standard approach for computation of the IFOF in a case of a patient with a large left perisylvian tumor. The IFOF was computed by using the standard and the nTMS-based DTI-FT, obtaining two completely different results. (A) The IFOF computed by using the standard approach (orange) appears running below the lesion. Some aberrant fibers are visualized medially to its main trunk. (B) The IFOF obtained by using the nTMS-based strategy (green) is running above the lesion, being displaced upward. No aberrant fibers are visualized anymore.

