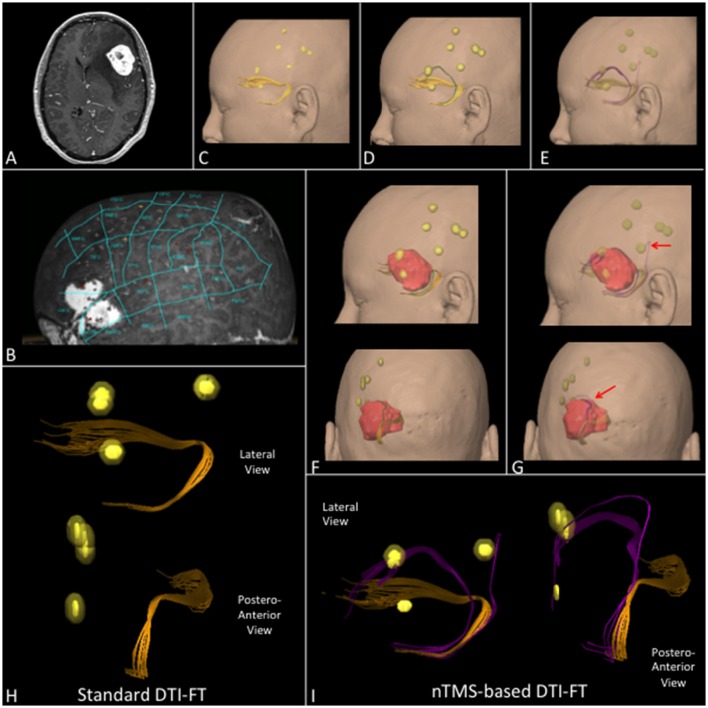
Figure 7.
(A) T1-weighted contrast enhanced sequence showing a case of a left frontal hemangioma. (B) nTMS language mapping findings according to Corina's cortical parcellation system (Corina et al., 2005, 2010). (C) Lateral view of UF (orange) computed by using the standard, (D) the nTMS-based “all-spots” and (E) the “single-spot” DTI-FT showing additional fibers (respectively green and purple). (F) Lateral and postero-anterior view of UF by using the “all-spot” and (G) the “single-spot” strategy and its spatial relationship with nTMS spots (yellow) and tumor (red). Additional fibers (purple) connecting the UF with nTMS spots obtained by using the “single-spot” technique are indicated by red arrows. (H) 3D reconstruction of the UF in the lateral and postero-anterior view computed by using standard and (I) nTMS-based “single-spot” DTI FT. Additional fibers (purple) and their connection with nTMS-spots are evident.

