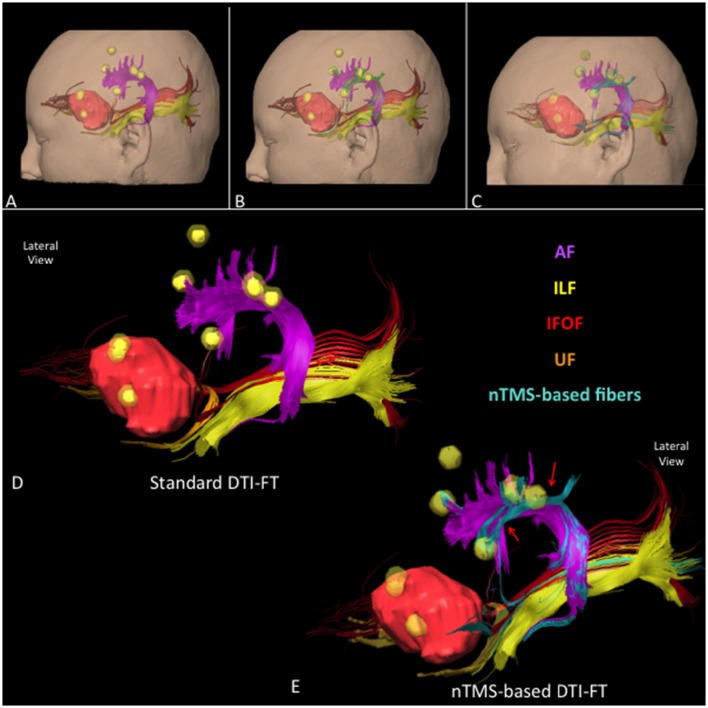
Figure 8.
Lateral view of all language fascicles in a case of a left frontal anaplastic astrocytoma obtained through (A) standard, (B) nTMS-based “all-spots”, and (C) “single-spot” DTI-FT. The spatial relationship between AF (purple), UF (orange), IFOF (red), ILF (light yellow), tumor (light red) and nTMS spots (yellow) is showed. Additional fibers are depicted in green for the “all-spot” and in light blue for the “single-spot” strategy. (D) 3D reconstruction of the language cortico-subcortical network by using the standard, and (E) the nTMS-based “single-spot” DTI-FT. Additional fibers connecting fascicles to cortical nTMS spots are highlighted (light blue fibers, red arrows).

