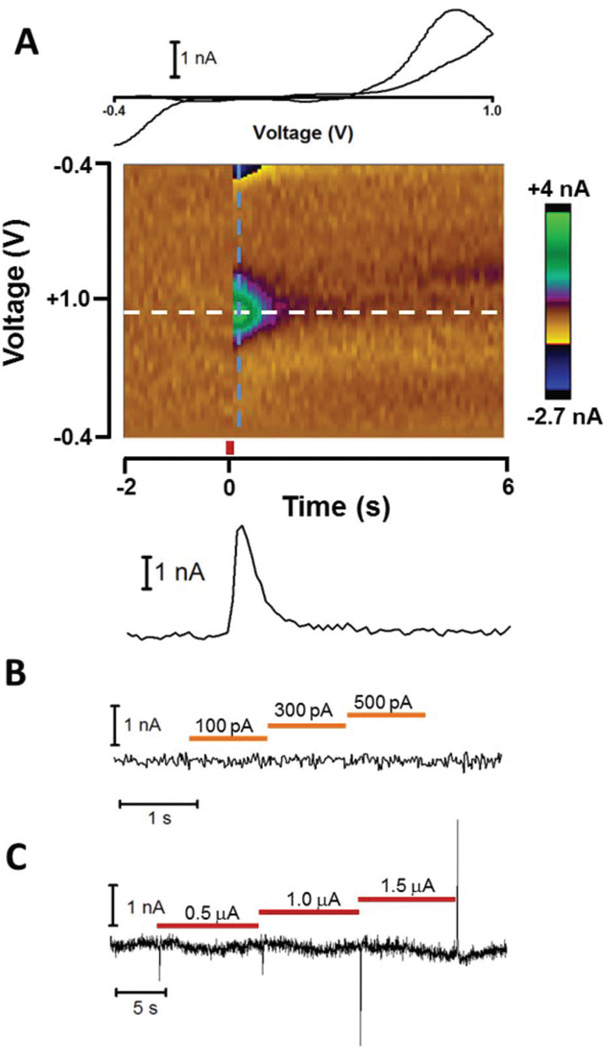
Fig. 3.
Effect of patch and iontophoresis instruments on FSCV measurements. (A) FSCV response to electrically evoked DA release. A carbon-fiber electrode detected electrically evoked DA release in the NAc core of a rat brain slice while a neighboring patch pipette and iontophoresis barrel maintained zero net current. The DA CV (upper) was obtained from the color plot (middle) using the current across the waveform just after stimulation (dashed blue line). A DA current versus time trace (lower) was generated from the current at the DA oxidation potential over the time-course of the measurement. Stimulation (red bar) occurred at t = 0. (B) FSCV signal along the DA oxidation potential during current steps administered by the patch pipette. Orange bars represent the time of the applied current. (C) FSCV signal along the DA oxidation potential during iontophoretic ejection (red bars) of NaCl.

